Building a Trace Receiver
If you are reading this tutorial, you probably already have an idea of the OpenTelemetry concepts behind distributed tracing, but if you don’t you can quickly read through it here.
Here is the definition of those concepts according to OpenTelemetry:
Traces track the progression of a single request, called a trace, as it is handled by services that make up an application. The request may be initiated by a user or an application. Distributed tracing is a form of tracing that traverses process, network and security boundaries.
Although the definition seems very application centric, you can leverage the OpenTelemetry trace model as a way to represent a request and quickly understand it’s duration and the details about every step involved in completing it.
Assuming you already have a system generating some kind of tracing telemetry, the OpenTelemetry Collector is the doorway to help you make it available into the OTel world.
Within the Collector, a trace receiver has the role to receive and convert your request telemetry from it’s original format into the OTel trace model, so the information can be properly processed through the Collector’s pipelines.
In order to implement a traces receiver you will need the following:
A
Configimplementation to enable the trace receiver to gather and validate it’s configurations within the Collector’s config.yaml.A
ReceiverFactoryimplementation so the Collector can properly instantiate the trace receiver componentA
TracesReceiverimplementation that is responsible to collect the telemetry, convert it to the internal trace representation, and hand the information to the next consumer in the pipeline.
In this tutorial we will create a sample trace receiver called tailtracer that
simulates a pull operation and generates traces as an outcome of that operation.
The next sections will guide you through the process of implementing the steps
above in order to create the receiver, so let’s get started.
Setting up your receiver development and testing environment
First use the Building a Custom Collector tutorial to create a Collector instance named dev-otelcol; all you need is to
copy the builder-config.yaml described on Step 2 and make the following changes:
dist:
  name: dev-otelcol # the binary name. Optional.
  output_path: ./dev-otelcol # the path to write the output (sources and binary). Optional.
As an outcome you should now have a dev-otelcol folder with your Collector’s
development instance ready to go.
In order to properly test your trace receiver, you will need a distributed
tracing backend so the Collector can send the telemetry to it. We will be using
Jaeger, if you
don’t have a Jaeger instance running, you can easily start one using Docker
with the following command:
docker run -d --name jaeger \
  -p 16686:16686 \
  -p 14268:14268 \
  -p 14250:14250 \
  jaegertracing/all-in-one:1.29
Now, create a config.yaml file so you can setup your Collector’s components.
cd dev-otelcol
touch config.yaml
For now, you just need a basic traces pipeline with the otlp receiver, the
jaeger and logging exporters, here is what your config.yaml file should
look like:
config.yaml
receivers:
  otlp:
    protocols:
      grpc:

processors:

exporters:
  logging:
    logLevel: debug
  jaeger:
    endpoint: localhost:14250
    tls:
      insecure: true

service:
  pipelines:
    traces:
      receivers: [otlp]
      processors: []
      exporters: [jaeger, logging]
Notice that I am only using the insecure flag in my jaeger receiver config
to make my local development setup easier; you should not use this flag when
running your collector in production.
In order to verify that your initial pipeline is properly setup, you should have
the following output after running your dev-otelcol command:
dev-otelcol % ./dev-otelcol --config config.yaml
2022-06-21T13:02:09.253-0500    info    builder/exporters_builder.go:255        Exporter was built.     {"kind": "exporter", "name": "jaeger"}
2022-06-21T13:02:09.254-0500    info    builder/exporters_builder.go:255        Exporter was built.     {"kind": "exporter", "name": "logging"}
2022-06-21T13:02:09.254-0500    info    builder/pipelines_builder.go:224        Pipeline was built.     {"kind": "pipeline", "name": "traces"}
2022-06-21T13:02:09.254-0500    info    builder/receivers_builder.go:225        Receiver was built.     {"kind": "receiver", "name": "otlp", "datatype": "traces"}
2022-06-21T13:02:09.254-0500    info    service/telemetry.go:102        Setting up own telemetry...
2022-06-21T13:02:09.255-0500    info    service/telemetry.go:141        Serving Prometheus metrics      {"address": ":8888", "level": "basic"}
2022-06-21T13:02:09.255-0500    info    service/service.go:93   Starting extensions...
2022-06-21T13:02:09.255-0500    info    service/service.go:98   Starting exporters...
2022-06-21T13:02:09.255-0500    info    builder/exporters_builder.go:40 Exporter is starting... {"kind": "exporter", "name": "jaeger"}
2022-06-21T13:02:09.258-0500    info    builder/exporters_builder.go:48 Exporter started.       {"kind": "exporter", "name": "jaeger"}
2022-06-21T13:02:09.258-0500    info    jaegerexporter@v0.53.0/exporter.go:186  State of the connection with the Jaeger Collector backend       {"kind": "exporter", "name": "jaeger", "state": "IDLE"}
2022-06-21T13:02:09.258-0500    info    builder/exporters_builder.go:40 Exporter is starting... {"kind": "exporter", "name": "logging"}
2022-06-21T13:02:09.258-0500    info    builder/exporters_builder.go:48 Exporter started.       {"kind": "exporter", "name": "logging"}
2022-06-21T13:02:09.258-0500    info    service/service.go:103  Starting processors...
2022-06-21T13:02:09.258-0500    info    builder/pipelines_builder.go:54 Pipeline is starting... {"kind": "pipeline", "name": "traces"}
2022-06-21T13:02:09.258-0500    info    builder/pipelines_builder.go:65 Pipeline is started.    {"kind": "pipeline", "name": "traces"}
2022-06-21T13:02:09.258-0500    info    service/service.go:108  Starting receivers...
2022-06-21T13:02:09.258-0500    info    builder/receivers_builder.go:67 Receiver is starting... {"kind": "receiver", "name": "otlp"}
2022-06-21T13:02:09.258-0500    info    otlpreceiver/otlp.go:70 Starting GRPC server on endpoint localhost:55690        {"kind": "receiver", "name": "otlp"}
2022-06-21T13:02:09.261-0500    info    builder/receivers_builder.go:72 Receiver started.       {"kind": "receiver", "name": "otlp"}
2022-06-21T13:02:09.262-0500    info    service/collector.go:226        Starting dev-otelcol... {"Version": "1.0.0", "NumCPU": 12}
2022-06-21T13:02:09.262-0500    info    service/collector.go:134        Everything is ready. Begin running and processing data.
2022-06-21T13:02:10.258-0500    info    jaegerexporter@v0.53.0/exporter.go:186  State of the connection with the Jaeger Collector backend       {"kind": "exporter", "name": "jaeger", "state": "READY"}
Make sure you see the last line, that will confirm that the Jaeger exporter has successfully established a connection to your local Jaeger instance. Now that we have our environment ready, let’s start writing your receiver’s code.
Now, create another folder called tailtracer so we can have a place to host
all of our receiver code
mkdir tailtracer
Every Collector’s component should be created as a Go module, so you will need
to properly initialize the tailtracer module. In my case here is what the
command looked like:
cd tailtracer
go mod init github.com/rquedas/otel4devs/collector/receiver/trace-receiver/tailtracer
Reading and Validating your Receiver Settings
In order to be instantiated and participate in pipelines the Collector needs to identify your receiver and properly load it’s settings from within it’s configuration file.
The tailtracer receiver will have the following settings:
interval: a string representing the time interval (in minutes) between telemetry pull operationsnumber_of_traces: the number os mock traces generated for each interval
Here is what the tailtracer receiver settings will look like:
receivers:
  tailtracer: #this line represents the ID of your receiver
    interval: 1m
    number_of_traces: 1
Under the tailtracer folder, create a file named config.go where you will
write all the code to support your receiver settings.
cd tailtracer
touch config.go
To implement the configuration aspects of a receiver you need create a Config
struct, so go ahead the add the following code to your config.go file:
package tailtracer

type Config struct{

}
In order to be able to give your receiver access to it’s settings the Config
struct must:
embed the config.ReceiverSettings struct or a struct that extends it.
Add a field for each of the receiver’s settings.
Here is what your config.go file should look like after you implemented the requirements above
config.go
package tailtracer

import (
  "go.opentelemetry.io/collector/config"
)

// Config represents the receiver config settings within the collector's config.yaml
type Config struct {
   config.ReceiverSettings `mapstructure:",squash"`
   Interval    string `mapstructure:"interval"`
   NumberOfTraces int `mapstructure:"number_of_traces"`
}
Check your work
- I imported the
go.opentelemetry.io/collector/configpackage, which is where ReceiverSettings is declared.- I embedded the
config.ReceiverSettingsas required by the spec.- I added the
Intervaland theNumberOfTracesfields so I can properly have access to their values from the config.yaml.
Now that you have access to the settings, you can provide any kind of validation
needed for those values by implementing the Validate method according to the
validatable
interface.
In this case, the interval value will be optional (we will look at generating
default values later) but when defined should be at least 1 minute (1m) and the
the number_of_traces will be a required value. Here is what the config.go
looks like after implementing the Validate method.
config.go
package tailtracer

import (
  "fmt"
  "go.opentelemetry.io/collector/config"
)

// Config represents the receiver config settings within the collector's config.yaml
type Config struct {
   config.ReceiverSettings `mapstructure:",squash"`
   Interval    string `mapstructure:"interval"`
   NumberOfTraces int `mapstructure:"number_of_traces"`
}


// Validate checks if the receiver configuration is valid
func (cfg *Config) Validate() error {
    interval, _ := time.ParseDuration(cfg.Interval)
	if (interval.Minutes() < 1){
	   return fmt.Errorf("when defined, the interval has to be set to at least 1 minute (1m)")
	}

	if (cfg.NumberOfTraces < 1){
	   return fmt.Errorf("number_of_traces must be greater or equal to 1")
	}
	return nil
 }
Check your work
- I imported the
fmtpackage, so I can properly format print my error messages.- I added the
Validatemethod to my Config struct where I am checking if theintervalsetting value is at least 1 minute (1m) and if thenumber_of_tracessetting value is greater or equal to 1. If that is not true the Collector will generate an error during it’s startup process and display the message accordingly.
If you want to take a closer look at the structs and interfaces involved in the configuration aspects of a receiver component, take a look at the config/receiver.go file inside the Collector’s GitHub project.
Enabling the Collector to instantiate your receiver
At the beginning of this tutorial, you created your dev-otelcol instance,
which is bootstrapped with the following components:
- Receivers: OTLP Receiver
- Processors: Batch Processor
- Exporters: Logging and Jaeger Exporters
Go ahead and open the components.go file under the dev-otelcol folder, and
let’s take a look at the components() function.
func components() (component.Factories, error) {
	var err error
	factories := component.Factories{}

	factories.Extensions, err = component.MakeExtensionFactoryMap(
	)
	if err != nil {
		return component.Factories{}, err
	}

	factories.Receivers, err = component.MakeReceiverFactoryMap(
		otlpreceiver.NewFactory(),
	)
	if err != nil {
		return component.Factories{}, err
	}

	factories.Exporters, err = component.MakeExporterFactoryMap(
		jaegerexporter.NewFactory(),
		loggingexporter.NewFactory(),
	)
	if err != nil {
		return component.Factories{}, err
	}

	factories.Processors, err = component.MakeProcessorFactoryMap(
		batchprocessor.NewFactory(),
	)
	if err != nil {
		return component.Factories{}, err
	}

	return factories, nil
}
As you can see, the components() function is responsible to provide the
Collector the factories for all it’s components which is represented by a
variable called factories of type component.Factories (here is the
declaration of the
component.Factories
struct), which will then be used to instantiate the components that are
configured and consumed by the Collector’s pipelines.
Notice that factories.Receivers is the field holding a map to all the receiver
factories (instances of ReceiverFactory), and it currently has the
otlpreceiver factory only which is instantiated through the
otlpreceiver.NewFactory() function call.
The tailtracer receiver has to provide a ReceiverFactory implementation, and
although you will find a ReceiverFactory interface (you can find it’s
definition in the
component/receiver.go
file within the Collector’s project ), the right way to provide the
implementation is by using the functions available within the
go.opentelemetry.io/collector/component package.
Implementing your ReceiverFactory
Start by creating a file named factory.go within the tailtracer folder
cd tailtracer
touch factory.go
Now let’s follow the convention and add a function named NewFactory() that
will be responsible to instantiate the tailtracer factory. Go ahead the add
the following code to your factory.go file:
package tailtracer

import (
	"go.opentelemetry.io/collector/component"
)

// NewFactory creates a factory for tailtracer receiver.
func NewFactory() component.ReceiverFactory {

}
In order to instantiate your tailtracer receiver factory, you will use the
following function from the component package:
func NewReceiverFactory(cfgType config.Type, createDefaultConfig ReceiverCreateDefaultConfigFunc, options ...ReceiverFactoryOption)) component.ReceiverFactory
The component.NewReceiverFactory() instantiates and returns a
component.ReceiverFactory and it requires the following parameters:
config.Type: A config.Type instance representing a unique identifier for your receiver across all Collector’s components.ReceiverCreateDefaultConfigFunc: A reference to a function that returns the config.Receiver instance for your receiver.... ReceiverFactoryOption: The slice of ReceiverFactoryOptions that will determine what type of signal your receiver is capable of processing.
Let’s now implement the code to support all the parameters required by
component.NewReceiverFactory()
Identifying and Providing default settings for the receiver
If you take a look at the definition of config.Type, you will see that it’s just a string. So all we need to do is to provide a string constant representing the unique identifier for our receiver.
Previously, we said that the interval setting for our tailtracer receiver
would be optional, in that case you will need to provide a default value for it
so it can be used as part of the default settings.
Go ahead and add the following code to your factory.go file:
const (
	typeStr = "tailtracer"
	defaultInterval = 1 * time.Minute
)
As for default settings, you just need to add a function that returns a
config.Receiver holding the default configurations for the tailtracer
receiver.
To accomplish that, go ahead and add the following code to your factory.go
file:
func createDefaultConfig() config.Receiver {
	return &Config{
		ReceiverSettings:   config.NewReceiverSettings(config.NewComponentID(typeStr)),
		Interval: defaultInterval,
	}
}
After these two changes you will notice a few imports are missing, so here is
what your factory.go file should look like with the proper imports:
factory.go
package tailtracer

import (
	"time"
	"go.opentelemetry.io/collector/component"
	"go.opentelemetry.io/collector/config"
)

const (
	typeStr = "tailtracer"
	defaultInterval = 1 * time.Minute
)

func createDefaultConfig() config.Receiver {
	return &Config{
		ReceiverSettings:   config.NewReceiverSettings(config.NewComponentID(typeStr)),
		Interval: defaultInterval,
	}
}

// NewFactory creates a factory for tailtracer receiver.
func NewFactory() component.ReceiverFactory {
  return nil
}
Check your work
- Importing the
timepackage in order to support the time.Duration type for the defaultInterval- Importing the
go.opentelemetry.io/collector/configpackage, which is where the Receiver interface and the NewReceiverSettings() and NewComponentID() functions are declared.- Added a string constant called
typeStrto represent the unique identifier (component ID) of the receiver and assignedtailtraceras it’s value. This ID is going to be used to fetch the receiver settings from the Collector’s config.- Added a
time.Durationconstant calleddefaultIntervalto represent the default value for our receiver’sIntervalsetting. We will be setting the default value for 1 minute hence the assignment of1 * time.Minuteas it’s value.- Added a function called
createDefaultConfigwhich is responsible to return a config.Receiver implementation, which in this case is going to be an instance of ourtailtracer.Configstruct.
- The
tailtracer.Config.ReceiverSettingsfield was initialized using theconfig.NewReceiverSettingsfunction which returns aconfig.ReceiverSettingsinstance based on a givenconfig.ComponentID.- To provide the proper
config.ComponentID, we used the functionconfig.NewComponentIDwhich returns aconfig.ComponentIDfor the givenconfig.Typewhich in our case is represented by the variabletypeStr- The
tailtracer.Config.Intervalfield was initialized with thedefaultIntervalconstant.
If you take a closer look at the ReceiverSettings struct and
NewReceiverSettings function (they are declared within the
config/receiver.go
file inside the Collector’s GitHub project), you will find out that the
ReceiverSettings is implementing the methods to support the identifiable
interface which are also required by any Collector’s component.
All the types and functions involved in supporting the requirements for component’s identification are implemented within the config/identifiable.go file inside the Collector’s GitHub project.
Enabling the factory to describe the receiver as capable of processing traces
The same receiver component can process traces, metrics, and logs. The receiver’s factory is responsible for describing those capabilities.
Given that traces are the subject of the tutorial, that’s the only signal we
will enable the tailtracer receiver to work with. The components package
provides the following function and type to help the factory describe the trace
processing capabilities:
func WithTracesReceiver(createTracesReceiver CreateTracesReceiver) ReceiverFactoryOption
type CreateTracesReceiver func(context.Context, component.ReceiverCreateSettings, config.Receiver, consumer.Traces) (component.TracesReceiver, error)
The component.WithTracesReceiver() instantiates and returns a
component.ReceiverFactoryOption and it requires the following parameters:
CreateTracesReceiver: A reference to a function that matches thecomponent.CreateTracesReceivertype
The component.CreateTracesReceiver type is a pointer to a function that is
responsible to instantiate and return a component.TraceReceiver instance and
it requires the following parameters:
context.Context: the reference to the Collector’scontext.Contextso your trace receiver can properly manage it’s execution context.component.ReceiverCreateSettings: the reference to some of the Collector’s settings under which your receiver is created.config.Receiver: the reference for the receiver config settings passed by the Collector to the factory so it can properly read it’s settings from the Collector config.consumer.Traces: the reference to the nextconsumer.Tracesin the pipeline, which is where received traces will go. This is either a processor or an exporter.
Start by adding the bootstrap code to properly implement the
component.CreateTracesReceiver function pointer. Go ahead and add the
following code to your factory.go file:
func createTracesReceiver(_ context.Context, params component.ReceiverCreateSettings, baseCfg config.Receiver, consumer consumer.Traces) (component.TracesReceiver, error) {
  return nil,nil
}
You now have all the necessary components to successfully instantiate your
receiver factory using the component.NewReceiverFactory function. Go ahead and
and update your NewFactory() function in your factory.go file as follow:
// NewFactory creates a factory for tailtracer receiver.
func NewFactory() component.ReceiverFactory {
	return component.NewReceiverFactory(
		typeStr,
		createDefaultConfig,
		component.WithTracesReceiver(createTracesReceiver))
}
After these two changes you will notice a few imports are missing, so here is
what your factory.go file should look like with the proper imports:
factory.go
package tailtracer

import (
	"context"
	"time"

	"go.opentelemetry.io/collector/component"
	"go.opentelemetry.io/collector/config"
	"go.opentelemetry.io/collector/consumer"
)

const (
	typeStr = "tailtracer"
	defaultInterval = 1 * time.Minute
)

func createDefaultConfig() config.Receiver {
	return &Config{
		ReceiverSettings:   config.NewReceiverSettings(config.NewComponentID(typeStr)),
		Interval: defaultInterval,
	}
}

func createTracesReceiver(_ context.Context, params component.ReceiverCreateSettings, baseCfg config.Receiver, consumer consumer.Traces) (component.TracesReceiver, error) {
  return nil,nil
}

// NewFactory creates a factory for tailtracer receiver.
func NewFactory() component.ReceiverFactory {
	return component.NewReceiverFactory(
		typeStr,
		createDefaultConfig,
		component.WithTracesReceiver(createTracesReceiver))
}
Check your work
- Importing the
contextpackage in order to support thecontext.Contexttype referenced in thecreateTracesReceiverfunction- Importing the
go.opentelemetry.io/collector/consumerpackage in order to support theconsumer.Tracestype referenced in thecreateTracesReceiverfunction- Updated the
NewFactory()function so it returns thecomponent.ReceiverFactorygenerated by thecomponent.NewReceiverFactory()call with the required parameters. The generated receiver factory will be capable of processing traces through the call tocomponent.WithTracesReceiver(createTracesReceiver)
At this point, you have the tailtracer factory and config code needed for the
Collector to validate the tailtracer receiver settings if they are defined
within the config.yaml. You just need to add it to the Collector’s
initialization process.
Adding the receiver factory to the Collector’s initialization
As explained before, all the Collector components are instantiated by the
components() function within the components.go file.
The tailtracer receiver factory instance has to be added to the factories
map so the Collector can load it properly as part of it’s initialization
process.
Here is what the components.go file looks like after making the changes to
support that:
components.go
// Code generated by "go.opentelemetry.io/collector/cmd/builder". DO NOT EDIT.

package main

import (
	"go.opentelemetry.io/collector/component"
	jaegerexporter "github.com/open-telemetry/opentelemetry-collector-contrib/exporter/jaegerexporter"
	loggingexporter "go.opentelemetry.io/collector/exporter/loggingexporter"
	batchprocessor "go.opentelemetry.io/collector/processor/batchprocessor"
	otlpreceiver "go.opentelemetry.io/collector/receiver/otlpreceiver"
	tailtracer "github.com/rquedas/otel4devs/collector/receiver/trace-receiver/tailtracer"
)

func components() (component.Factories, error) {
	var err error
	factories := component.Factories{}

	factories.Extensions, err = component.MakeExtensionFactoryMap(
	)
	if err != nil {
		return component.Factories{}, err
	}

	factories.Receivers, err = component.MakeReceiverFactoryMap(
		otlpreceiver.NewFactory(),
		tailtracer.NewFactory(),
	)
	if err != nil {
		return component.Factories{}, err
	}

	factories.Exporters, err = component.MakeExporterFactoryMap(
		jaegerexporter.NewFactory(),
		loggingexporter.NewFactory(),
	)
	if err != nil {
		return component.Factories{}, err
	}

	factories.Processors, err = component.MakeProcessorFactoryMap(
		batchprocessor.NewFactory(),
	)
	if err != nil {
		return component.Factories{}, err
	}

	return factories, nil
}
Check your work
- Importing the
github.com/rquedas/otel4devs/collector/receiver/trace-receiver/tailtracermodule which is where the receiver types and function are.- Added a call to
tailtracer.NewFactory()as a parameter of thecomponent.MakeReceiverFactoryMap()call so yourtailtracerreceiver factory is properly added to thefactoriesmap.
We added the tailtracer receiver settings to the config.yaml previously, so
here is what the beginning of the output for running your Collector with
dev-otelcol command should look like after building it with the current
codebase:
dev-otelcol % ./dev-otelcol --config config.yaml
2022-02-24T12:17:41.454-0600    info    service/collector.go:190        Applying configuration...
2022-02-24T12:17:41.454-0600    info    builder/exporters_builder.go:254        Exporter was built.     {"kind": "exporter", "name": "logging"}
2022-02-24T12:17:41.454-0600    info    builder/exporters_builder.go:254        Exporter was built.     {"kind": "exporter", "name": "jaeger"}
2022-02-24T12:17:41.454-0600    info    builder/pipelines_builder.go:222        Pipeline was built.     {"name": "pipeline", "name": "traces"}
2022-02-24T12:17:41.454-0600    info    builder/receivers_builder.go:111        Ignoring receiver as it is not used by any pipeline      {"kind": "receiver", "name": "tailtracer"}
2022-02-24T12:17:41.454-0600    info    builder/receivers_builder.go:224        Receiver was built.     {"kind": "receiver", "name": "otlp", "datatype": "traces"}
2022-02-24T12:17:41.454-0600    info    service/service.go:86   Starting extensions...
2022-02-24T12:17:41.454-0600    info    service/service.go:91   Starting exporters...
Look for the log line for “builder/receivers_builder.go:111” (it’s the 4th line
from the bottom at the snippet showed here), you can see that the Collector
found the settings for the tailtracer receiver, validated them (the current
settings are all correct), but ignores the receiver given that it’s not used in
any pipeline.
Let’s check if the tailtracer factory is validating the receiver settings
correctly, the interval setting isn’t required, so if you remove it from the
config.yaml and run the command again you should get the same output.
Now, let’s test one of the tailtracer settings validation rules. Remove the
number_of_traces setting from the config.yaml, and here is what the output
for running the Collector will look like:
dev-otelcol % ./dev-otelcol --config config.yaml
Error: invalid configuration: receiver "tailtracer" has invalid configuration: number_of_traces must be at least 1
2022/02/24 13:00:20 collector server run finished with error: invalid configuration: receiver "tailtracer" has invalid configuration: number_of_traces must be at least 1
The tailtracer receiver factory and config requirements are done and the
Collector is properly loading your component. You can now move to the core of
your receiver, the implementation of the component itself.
Implementing the trace receiver component
In the previous section, I mentioned the fact that a receiver can process any of the OpenTelemetry signals, and the Collector’s API is designed to help you accomplish that.
All the receiver APIs responsible to enable the signals are currently declared in the component/receiver.go file within the OTel Collector’s project in GitHub, open the file and take a minute to browse through all the interfaces declared in it.
Notice that component.TracesReceiver (and it’s siblings
component.MetricsReceiver and component.LogsReceiver) at this point in time,
doesn’t describe any specific methods other than the ones it “inherits” from
component.Receiver which also doesn’t describe any specific methods other than
the ones it “inherits” from component.Component.
It might feel weird, but remember, the Collector’s API was meant to be extensible, and the components and their signals might evolve in different ways, so the role of those interfaces exist to help support that.
So, to create a component.TracesReceiver, you just need to implement the
following methods described by component.Component interface:
Start(ctx context.Context, host Host) error
Shutdown(ctx context.Context) error
Both methods actually act as event handlers used by the Collector to communicate with its components as part of their lifecycle.
The Start() represents a signal of the Collector telling the component to
start its processing. As part of the event, the Collector will pass the
following information:
context.Context: Most of the time, a receiver will be processing a long-running operation, so the recommendation is to ignore this context and actually create a new one from context.Background().Host: The host is meant to enable the receiver to communicate with the Collector’s host once it’s up and running.
The Shutdown() represents a signal of the Collector telling the component that
the service is getting shutdown and as such the component should stop it’s
processing and make all the necessary cleanup work required:
context.Context: the context passed by the Collector as part of the shutdown operation.
You will start the implementation by creating a new file called
trace-receiver.go within your project’s tailtracer folder and add the
declaration to a type type called tailtracerReceiver as follow:
type tailtracerReceiver struct{

}
Now that you have the tailtracerReceiver type you can implement the Start()
and Shutdown() methods so the receiver type can be compliant with the
component.TraceReceiver interface.
Here is what the tailtracer/trace-receiver.go file should look like with the
methods implementation:
trace-receiver.go
package tailtracer

import (
	"context"
	"go.opentelemetry.io/collector/component"
)

type tailtracerReceiver struct {

}

func (tailtracerRcvr *tailtracerReceiver) Start(ctx context.Context, host component.Host) error {
	return nil
}

func (tailtracerRcvr *tailtracerReceiver) Shutdown(context.Context) error {
	return nil
}
Check your work
- Importing the
contextpackage which is where theContexttype and functions are declared- Importing the
go.opentelemetry.io/collector/componentpackage which is where theHosttype is declared- Added a bootstrap implementation of the
Start(ctx context.Context, host component.Host)method to comply with thecomponent.TraceReceiverinterface.- Added a bootstrap implementation of the
Shutdown(ctx context.Context)method to comply with thecomponent.TraceReceiverinterface.
The Start() method is passing 2 references (context.Context and
component.Host) that your receiver might need to keep so they can be used as
part of it’s processing operations.
The context.Context reference should be used for creating a new context to
support you receiver processing operations, and in that case you will need to
decide the best way to handle context cancellation so you can finalize it
properly as part of the component’s shutdown within the Shutdown() method.
The component.Host can be useful during the whole lifecycle of the receiver so
you should keep that reference within your tailtracerReceiver type.
Here is what the tailtracerReceiver type declaration will look like after you
include the fields for keeping the references suggested above:
type tailtracerReceiver struct {
  host component.Host
  cancel context.CancelFunc
}
Now you need to update the Start() methods so the receiver can properly
initialize it’s own processing context and have the cancellation function kept
in the cancel field and also initialize it’s host field value. You will also
update the Stop() method in order to finalize the context by calling the
cancel function.
Here is what the trace-receiver.go file look like after making the changes
above:
trace-receiver.go
package tailtracer

import (
	"context"
	"go.opentelemetry.io/collector/component"
)

type tailtracerReceiver struct {
    host component.Host
	cancel context.CancelFunc
}

func (tailtracerRcvr *tailtracerReceiver) Start(ctx context.Context, host component.Host) error {
    tailtracerRcvr.host = host
    ctx = context.Background()
	ctx, tailtracerRcvr.cancel = context.WithCancel(ctx)

	return nil
}

func (tailtracerRcvr *tailtracerReceiver) Shutdown(ctx context.Context) error {
	tailtracerRcvr.cancel()
	return nil
}
Check your work
- Updated the
Start()method by adding the initialization to thehostfield with thecomponent.Hostreference passed by the Collector and thecancelfunction field with the cancellation based on a new context created withcontext.Background()(according the Collector’s API documentation suggestions).- Updated the
Stop()method by adding a call to thecancel()context cancellation function.
Keeping information passed by the receiver’s factory
Now that you have implemented the component.TraceReceiver interface methods,
your tailtracer receiver component is ready to be instantiated and returned by
its factory.
Open the tailtracer/factory.go file and navigate to the
createTracesReceiver() function. Notice that the factory will pass references
as part of the createTracesReceiver() function parameters that your receiver
actually requires to work properly like it’s configuration settings
(config.Receiver), the next Consumer in the pipeline that will consume the
generated traces (consumer.Traces) and the Collector’s logger so the
tailtracer receiver can add meaningful events to it
(component.ReceiverCreateSettings).
Given that all this information will be only be made available to the receiver
at the moment its instantiated by the factory, The tailtracerReceiver type
will need fields to keep that information and use it within other stages of its
lifecycle.
Here is what the trace-receiver.go file looks like with the updated
tailtracerReceiver type declaration:
trace-receiver.go
package tailtracer

import (
	"context"
	"go.opentelemetry.io/collector/component"
	"go.opentelemetry.io/collector/consumer"
	"go.uber.org/zap"

)

type tailtracerReceiver struct {
    host         component.Host
	cancel       context.CancelFunc
	logger       *zap.Logger
	nextConsumer consumer.Traces
	config       *Config
}

func (tailtracerRcvr *tailtracerReceiver) Start(ctx context.Context, host component.Host) error {
    tailtracerRcvr.host = host
    ctx = context.Background()
	ctx, tailtracerRcvr.cancel = context.WithCancel(ctx)

	interval, _ := time.ParseDuration(tailtracerRcvr.config.Interval)
	go func() {
		ticker := time.NewTicker(interval)
		defer ticker.Stop()

		for {
			select {
			case <-ticker.C:
				tailtracerRcvr.logger.Info("I should start processing traces now!")
			case <-ctx.Done():
				return
			}
		}
	}()

	return nil
}

func (tailtracerRcvr *tailtracerReceiver) Shutdown(ctx context.Context) error {
	tailtracerRcvr.cancel()
	return nil
}
Check your work
- Importing the
go.opentelemetry.io/collector/consumerwhich is where the pipeline’s consumer types and interfaces are declared.- Importing the
go.uber.org/zappackage, which is what the Collector uses for it’s logging capabilities.- Added a
zap.Loggerfield namedloggerso we can have access to the Collector’s logger reference from within the receiver.- Added a
consumer.Tracesfield namednextConsumerso we can push the traces generated by thetailtracerreceiver to the next consumer declared in the Collector’s pipeline.- Added a
Configfield namedconfigso we can have access to receiver’s configuration settings defined within the Collector’s config.- Added a variable named
intervalthat will be initialized as atime.Durationbased on the value of theintervalsettings of thetailtracerreceiver defined within the Collector’s config.- Added a
go func()to implement thetickermechanism so our receiver can generate traces every time thetickerreaches the amount of time specified by theintervalvariable and used thetailtracerRcvr.loggerfield to generate a info message every time the receiver supposed to be generating traces.
The tailtracerReceiver type is now ready to be instantiated and keep all
meaningful information passed by its factory.
Open the tailtracer/factory.go file and navigate to the
createTracesReceiver() function.
The receiver is only instantiated if it’s declared as a component within a pipeline and the factory is responsible to make sure the next consumer (either a processor or exporter) in the pipeline is valid otherwise it should generate an error.
The Collector’s API provides some standard error types to help the factory
handle pipeline configurations. Your receiver factory should throw a
component.ErrNilNextConsumer in case the next consumer has an issue and is
passed as nil.
The createTracesReceiver() function will need a guard clause to make that
validation.
You will also need variables to properly initialize the config and the
logger fields of the tailtracerReceiver instance.
Here is what the factory.go file looks like with the updated
createTracesReceiver() function:
factory.go
package tailtracer

import (
	"context"

	"go.opentelemetry.io/collector/component"
	"go.opentelemetry.io/collector/config"
	"go.opentelemetry.io/collector/consumer"
)

const (
	typeStr = "tailtracer"
	defaultInterval = "1m"
)

func createDefaultConfig() config.Receiver {
	return &Config{
		ReceiverSettings:   config.NewReceiverSettings(config.NewComponentID(typeStr)),
		Interval: defaultInterval,
	}
}

func createTracesReceiver(_ context.Context, params component.ReceiverCreateSettings, baseCfg config.Receiver, consumer consumer.Traces) (component.TracesReceiver, error) {
	if consumer == nil {
		return nil, component.ErrNilNextConsumer
	}

	logger := params.Logger
	tailtracerCfg := baseCfg.(*Config)

	traceRcvr := &tailtracerReceiver{
		logger:       logger,
		nextConsumer: consumer,
		config:       tailtracerCfg,
	}

	return traceRcvr, nil

}

// NewFactory creates a factory for tailtracer receiver.
func NewFactory() component.ReceiverFactory {
	return component.NewReceiverFactory(
		typeStr,
		createDefaultConfig,
		component.WithTracesReceiver(createTracesReceiver))
}
Check your work
- Added a guard clause that verifies if the consumer is properly instantiated and if not returns the
component.ErrNilNextConsumererror.- Added a variable called
loggerand initialized it with the Collector’s logger that is available as a field namedLoggerwithin thecomponent.ReceiverCreateSettingsreference.- Added a variable called
tailtracerCfgand initialized it by casting theconfig.Receiverreference to thetailtracerreceiverConfig.- Added a variable called
traceRcvrand initialized it with thetailtracerReceiverinstance using the factory information stored within the variables.- Updated the return statement to now include the
traceRcvrinstance.
With the factory fully implemented and instantiating the trace receiver
component you are ready to test the receiver as part of a pipeline. Go ahead and
add the tailtracer receiver to your traces pipeline in the config.yaml as
follow:
service:
  pipelines:
    traces:
      receivers: [otlp, tailtracer]
      processors: []
      exporters: [jaeger, logging]
Here is what the output for running your Collector with dev-otelcol command
should look like after you updated the traces pipeline:
dev-otelcol % ./dev-otelcol --config config.yaml
2022-03-03T11:19:50.779-0600    info    service/collector.go:190        Applying configuration...
2022-03-03T11:19:50.780-0600    info    builder/exporters_builder.go:254        Exporter was built.     {"kind": "exporter", "name": "jaeger"}
2022-03-03T11:19:50.780-0600    info    builder/exporters_builder.go:254        Exporter was built.     {"kind": "exporter", "name": "logging"}
2022-03-03T11:19:50.780-0600    info    builder/pipelines_builder.go:222        Pipeline was built.     {"name": "pipeline", "name": "traces"}
2022-03-03T11:19:50.780-0600    info    builder/receivers_builder.go:224        Receiver was built.     {"kind": "receiver", "name": "otlp", "datatype": "traces"}
2022-03-03T11:19:50.780-0600    info    builder/receivers_builder.go:224        Receiver was built.     {"kind": "receiver", "name": "tailtracer", "datatype": "traces"}
2022-03-03T11:19:50.780-0600    info    service/service.go:86   Starting extensions...
2022-03-03T11:19:50.780-0600    info    service/service.go:91   Starting exporters...
2022-03-03T11:19:50.780-0600    info    builder/exporters_builder.go:40 Exporter is starting... {"kind": "exporter", "name": "jaeger"}
2022-03-03T11:19:50.781-0600    info    builder/exporters_builder.go:48 Exporter started.       {"kind": "exporter", "name": "jaeger"}
2022-03-03T11:19:50.781-0600    info    jaegerexporter@v0.41.0/exporter.go:186  State of the connection with the Jaeger Collector backend       {"kind": "exporter", "name": "jaeger", "state": "IDLE"}
2022-03-03T11:19:50.781-0600    info    builder/exporters_builder.go:40 Exporter is starting... {"kind": "exporter", "name": "logging"}
2022-03-03T11:19:50.781-0600    info    builder/exporters_builder.go:48 Exporter started.       {"kind": "exporter", "name": "logging"}
2022-03-03T11:19:50.781-0600    info    service/service.go:96   Starting processors...
2022-03-03T11:19:50.781-0600    info    builder/pipelines_builder.go:54 Pipeline is starting... {"name": "pipeline", "name": "traces"}
2022-03-03T11:19:50.781-0600    info    builder/pipelines_builder.go:65 Pipeline is started.    {"name": "pipeline", "name": "traces"}
2022-03-03T11:19:50.781-0600    info    service/service.go:101  Starting receivers...
2022-03-03T11:19:50.781-0600    info    builder/receivers_builder.go:68 Receiver is starting... {"kind": "receiver", "name": "otlp"}
2022-03-03T11:19:50.781-0600    info    otlpreceiver/otlp.go:69 Starting GRPC server on endpoint localhost:55680        {"kind": "receiver", "name": "otlp"}
2022-03-03T11:19:50.783-0600    info    builder/receivers_builder.go:73 Receiver started.       {"kind": "receiver", "name": "otlp"}
2022-03-03T11:19:50.783-0600    info    builder/receivers_builder.go:68 Receiver is starting... {"kind": "receiver", "name": "tailtracer"}
2022-03-03T11:19:50.783-0600    info    builder/receivers_builder.go:73 Receiver started.       {"kind": "receiver", "name": "tailtracer"}
2022-03-03T11:19:50.783-0600    info    service/telemetry.go:92 Setting up own telemetry...
2022-03-03T11:19:50.788-0600    info    service/telemetry.go:116        Serving Prometheus metrics      {"address": ":8888", "level": "basic", "service.instance.id": "0ca4907c-6fda-4fe1-b0e9-b73d789354a4", "service.version": "latest"}
2022-03-03T11:19:50.788-0600    info    service/collector.go:239        Starting dev-otelcol... {"Version": "1.0.0", "NumCPU": 12}
2022-03-03T11:19:50.788-0600    info    service/collector.go:135        Everything is ready. Begin running and processing data.
2022-03-21T15:19:51.717-0500	info	jaegerexporter@v0.46.0/exporter.go:186	State of the connection with the Jaeger Collector backend	{"kind": "exporter", "name": "jaeger", "state": "READY"}
2022-03-03T11:20:51.783-0600    info    tailtracer/trace-receiver.go:23  I should start processing traces now!   {"kind": "receiver", "name": "tailtracer"}
Look for the log line for “builder/receivers_builder.go:68 Receiver is
starting… {“kind”: “receiver”, “name”: “tailtracer”}”, you can see that the
Collector found the settings for the tailtracer receiver within the traces
pipeline and is now instantiating it and starting it given that 1 minute after
the Collector has started, you can see the info line we added to the ticker
function within the Start() method.
Now, go ahead and press Control+C in your Collector’s terminal so you want watch the shutdown process happening. Here is what the output should look like:
^C2022-03-03T11:20:14.652-0600  info    service/collector.go:166        Received signal from OS {"signal": "interrupt"}
2022-03-03T11:20:14.652-0600    info    service/collector.go:255        Starting shutdown...
2022-03-03T11:20:14.652-0600    info    service/service.go:121  Stopping receivers...
2022-03-03T11:20:14.653-0600    info    tailtracer/trace-receiver.go:29  I am done and ready to shutdown!        {"kind": "receiver", "name": "tailtracer"}
2022-03-03T11:20:14.653-0600    info    service/service.go:126  Stopping processors...
2022-03-03T11:20:14.653-0600    info    builder/pipelines_builder.go:73 Pipeline is shutting down...    {"name": "pipeline", "name": "traces"}
2022-03-03T11:20:14.653-0600    info    builder/pipelines_builder.go:77 Pipeline is shutdown.   {"name": "pipeline", "name": "traces"}
2022-03-03T11:20:14.653-0600    info    service/service.go:131  Stopping exporters...
2022-03-03T11:20:14.653-0600    info    service/service.go:136  Stopping extensions...
2022-03-03T11:20:14.653-0600    info    service/collector.go:273        Shutdown complete.
As you can see there is an info log line for the tailtracer receiver which
means the component is responding correctly to the Shutdown() event. In the
next section you will learn more about the OpenTelemetry Trace data model so the
tailtracer receiver can finally generate traces!
The Collector’s Trace Data Model
You might be familiar with OpenTelemetry traces by using the SDKs and instrumenting an application so you can see and evaluate your traces within a distributed tracing backend like Jaeger.
Here is what a trace looks like in Jaeger:
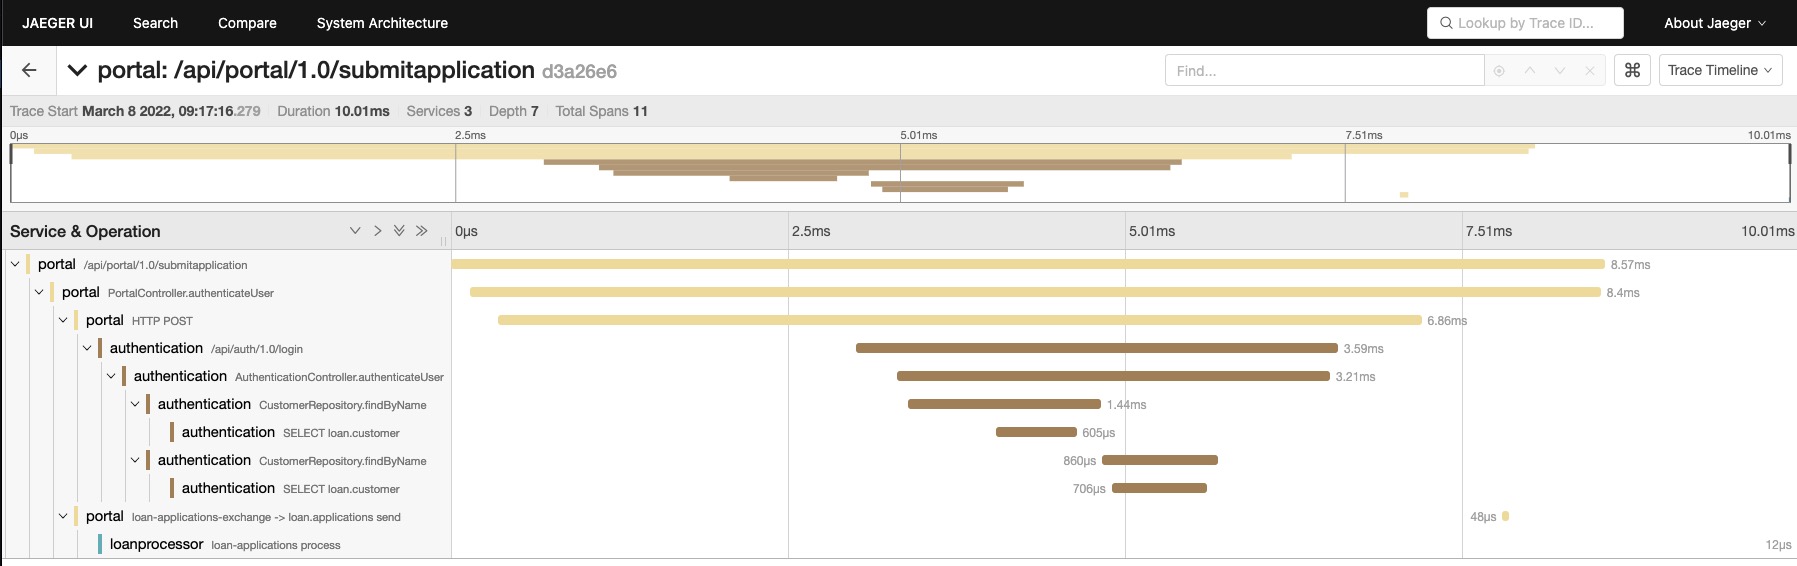
Granted, this is a Jaeger trace, but it was generated by a trace pipeline within the Collector, therefore you can use it to learn a few things about the OTel trace data model :
- A trace is made of one or multiple spans structured within a hierarchy to represent dependencies.
- The spans can represent operations within a service and/or across services.
Creating a trace within the trace receiver will be slightly different than the way you would do it with the SDKs, so let’s start reviewing the high level concepts.
Working with Resources
In the OTel world, all telemetry is generated by a Resource, here is the
definition according to the OTel
spec:
A
Resourceis an immutable representation of the entity producing telemetry as Attributes. For example, a process producing telemetry that is running in a container on Kubernetes has a Pod name, it is in a namespace and possibly is part of a Deployment which also has a name. All three of these attributes can be included in theResource.
Traces are most commonly used to represent a service request (the Services
entity described by Jaeger’s model), which are normally implemented as processes
running in a compute unit, but OTel’s API approach to describe a Resource
through attributes is flexible enough to represent any entity that you may
require like ATMs, IoT sensors, the sky is the limit.
So it’s safe to say that for a trace to exist, a Resource will have to start
it.
In this tutorial we will simulate a system that has telemetry that demonstrate
ATMs located in 2 different states (eg: Illinois and California) accessing the
Account’s backend system to execute balance, deposit and withdraw operations,
therefore we will have to implement code to create the Resource types
representing the ATM and the backend system.
Go ahead and create a file named model.go inside the tailtracer folder
cd tailtracer
touch model.go
Now, within the model.go file, add the definition for the Atm and the
BackendSystem types as follow:
model.go
package tailtracer

type Atm struct{
    ID           int64
	Version      string
	Name         string
	StateID      string
	SerialNumber string
	ISPNetwork   string
}

type BackendSystem struct{
	Version       string
	ProcessName   string
	OSType        string
    OSVersion     string
	CloudProvider string
	CloudRegion   string
	ServiceName   string
	Endpoint      string
}
These types are meant to represent the entities as they are within the system
been observed and they contain information that would be quite meaningful to be
added to the traces as part of the Resource definition. You will add some
helper functions to generate the instances of those types.
Here is what the model.go file will look with the helper functions:
model.go
package tailtracer

import (
	"math/rand"
	"time"
)

type Atm struct{
    ID           int64
	Version      string
	Name         string
	StateID      string
	SerialNumber string
	ISPNetwork   string
}

type BackendSystem struct{
	Version       string
	ProcessName   string
	OSType        string
    OSVersion     string
	CloudProvider string
	CloudRegion   string
	Endpoint      string
}

func generateAtm() Atm{
	i := getRandomNumber(1, 2)
    var newAtm Atm

	switch i {
		case 1:
			newAtm = Atm{
				ID: 111,
				Name: "ATM-111-IL",
				SerialNumber: "atmxph-2022-111",
				Version: "v1.0",
				ISPNetwork: "comcast-chicago",
				StateID: "IL",

			}

		case 2:
			newAtm = Atm{
				ID: 222,
				Name: "ATM-222-CA",
				SerialNumber: "atmxph-2022-222",
				Version: "v1.0",
				ISPNetwork: "comcast-sanfrancisco",
				StateID: "CA",
			}
	}

	return newAtm
}

func generateBackendSystem() BackendSystem{
    i := getRandomNumber(1, 3)

	newBackend := BackendSystem{
    	ProcessName: "accounts",
		Version: "v2.5",
		OSType: "lnx",
		OSVersion: "4.16.10-300.fc28.x86_64",
		CloudProvider: "amzn",
		CloudRegion: "us-east-2",
	}

	switch i {
		case 1:
		 	newBackend.Endpoint = "api/v2.5/balance"
		case 2:
		  	newBackend.Endpoint = "api/v2.5/deposit"
		case 3:
			newBackend.Endpoint = "api/v2.5/withdrawn"

	}

	return newBackend
}

func getRandomNumber(min int, max int) int {
	rand.Seed(time.Now().UnixNano())
	i := (rand.Intn(max - min + 1) + min)
    return i
}
Check your work
- Imported the
math/randandtimepackages to support the implementation of thegenerateRandomNumberfunction- Added the
generateAtmfunction that instantiates anAtmtype and randomly assign either Illinois or California as values forStateIDand the equivalent value forISPNetwork- Added the
generateBackendSystemfunction that instantiates aBackendSystemtype and randomly assign service endpoint values for theEndpointfield- Added the
generateRandomNumberfunction to help generating random numbers between a desired range.
Now that you have the functions to generate object instances representing the entities generating telemetry, you are ready to represent those entities in the OTel Collector world.
The Collector’s API provides a package named ptrace (nested under the pdata
package) with all the types, interfaces and helper functions required to work
with traces within the Collector’s pipeline components.
Open the tailtracer/model.go file and add
go.opentelemetry.io/collector/pdata/ptrace to the import clause so you can
have access to the ptrace package capabilities.
Before you can define a Resource, you need to create a ptrace.Traces that
will be responsible to propagate the traces through the Collector’s pipeline and
you can use the helper function ptrace.NewTraces() to instantiate it. You will
also need to create instances of the Atm and BackendSystem types so you can
have data to represent the telemetry sources involved in your trace.
Open the tailtracer/model.go file and add the following function to it:
func generateTraces() ptrace.Traces{
	traces := ptraces.NewTraces()

	for i := 0; i <= numberOfTraces; i++{
		newAtm := generateAtm()
		newBackendSystem := generateBackendSystem()
	}

	return traces
}
By now you have heard and read enough about how traces are made up of Spans. You have probably also written some instrumentation code using the SDK’s functions and types available to create them, but what you probably didn’t know, is that within the Collector’s API, that there are a other types of “spans” involved in creating a trace.
You will start with a type called ptrace.ResourceSpans which represents the
resource and all the operations that it either originated or received while
participating in a trace. You can find it’s definition within the
/pdata/internal/data/protogen/trace/v1/trace.pb.go.
ptrace.Traces has a method named ResourceSpans() which returns an instance
of a helper type called ptrace.ResourceSpansSlice. The
ptrace.ResourceSpansSlice type has methods to help you handle the array of
ptrace.ResourceSpans that will contain as many items as the number of
Resource entities participating in the request represented by the trace.
ptrace.ResourceSpansSlice has a method named AppendEmpty() that adds a new
ptrace.ResourceSpan to the array and return it’s reference.
Once you have an instance of a ptrace.ResourceSpan you will use a method named
Resource() which will return the instance of the pcommon.Resource associated
with the ResourceSpan.
Update the generateTrace() function with the following changes:
- add a variable named
resourceSpanto represent theResourceSpan - add a variable named
atmResourceto represent thepcommon.Resourceassociated with theResourceSpan. - Use the methods mentioned above to initialize both variables respectively.
Here is what the function should look like after you implemented these changes:
func generateTraces() ptrace.Traces{
	traces := ptrace.NewTraces()

	for i := 0; i <= numberOfTraces; i++{
		newAtm := generateAtm()
		newBackendSystem := generateBackendSystem()

		resourceSpan := traces.ResourceSpans().AppendEmpty()
		atmResource := resourceSpan.Resource()
	}

	return traces
}
Check your work
- Added the
resourceSpanvariable and initialized it with theResourceSpanreference returned by thetraces.ResourceSpans().AppendEmpty()call- Added the
atmResourcevariable and initialized it with thepcommon.Resourcereference returned by theresourceSpan.Resource()call
Describing Resources through attributes
The Collector’s API provides a package named pcommon (nested under the pdata
package) with all the types and helper functions required to describe a
Resource.
In the Collector’s world, a Resource is described by attributes in a key/value
pair format represented by the pcommon.Map type.
You can check the definition of the pcommon.Map type and the related helper
functions to create attribute values using the supported formats in the
/pdata/internal/common.go
file within the Otel Collector’s GitHub project.
Key/value pairs provide a lot of flexibility to help model your Resource data,
so the OTel specification has some guidelines in place to help organize and
minimize the conflicts across all the different types of telemetry generation
entities that it may need to represent.
Those guidelines are known as Resource Semantic Convention and can be found here within the OTel specification.
When creating your own attributes to represent your own telemetry generation entities, you should follow the guideline provided by the specification:
Attributes are grouped logically by the type of the concept that they described. Attributes in the same group have a common prefix that ends with a dot. For example all attributes that describe Kubernetes properties start with “k8s.”
Let’s start by opening the tailtracer/model.go and adding
go.opentelemetry.io/collector/pdata/pcommon to the import clause so you can
have access to the pcommon package capabilities.
Now go ahead and add a function to read the field values from an Atm instance
and write them as attributes (grouped by the prefix “atm.”) into a
pcommon.Resource instance. Here is what the function looks like:
func fillResourceWithAtm(resource *pcommon.Resource, atm Atm){
   atmAttrs := resource.Attributes()
   atmAttrs.InsertInt("atm.id", atm.ID)
   atmAttrs.InsertString("atm.stateid", atm.StateID)
   atmAttrs.InsertString("atm.ispnetwork", atm.ISPNetwork)
   atmAttrs.InsertString("atm.serialnumber", atm.SerialNumber)
}
Check your work
- Declared a variable called
atmAttrsand initialized it with thepcommon.Mapreference returned by theresource.Attributes()call- Used the
InsertInt()andInsertString()methods frompcommon.Mapto add int and string attributes based on the equivalentAtmfield types. Notice that because those attributes are very specific and only represent theAtmentity, they are all grouped within the “atm.” prefix.
The resource semantic conventions also have prescriptive attribute names and well-known values to represent telemetry generation entities that are common and applicable across different domains like compute unit, environment and others.
So, when you look at the BackendSystem entity, it has fields representing
OS
related information and
Cloud
related information, and we will use the attribute names and values prescribed
by the resource semantic convention to represent that information on it’s
Resource.
All the resource semantic convention attribute names and well known-values are kept within the /semconv/v1.9.0/generated_resource.go file within the Collector’s GitHub project.
Let’s create a function to read the field values from an BackendSystem
instance and write them as attributes into a pcommon.Resource instance. Open
the tailtracer/model.go file and add the following function:
func fillResourceWithBackendSystem(resource *pcommon.Resource, backend BackendSystem){
	backendAttrs := resource.Attributes()
	var osType, cloudProvider string

	switch {
		case backend.CloudProvider == "amzn":
			cloudProvider = conventions.AttributeCloudProviderAWS
		case backend.OSType == "mcrsft":
			cloudProvider = conventions.AttributeCloudProviderAzure
		case backend.OSType == "gogl":
			cloudProvider = conventions.AttributeCloudProviderGCP
	}

	backendAttrs.InsertString(conventions.AttributeCloudProvider, cloudProvider)
	backendAttrs.InsertString(conventions.AttributeCloudRegion, backend.CloudRegion)

	switch {
		case backend.OSType == "lnx":
			osType = conventions.AttributeOSTypeLinux
		case backend.OSType == "wndws":
			osType = conventions.AttributeOSTypeWindows
		case backend.OSType == "slrs":
			osType = conventions.AttributeOSTypeSolaris
	}

	backendAttrs.InsertString(conventions.AttributeOSType, osType)
	backendAttrs.InsertString(conventions.AttributeOSVersion, backend.OSVersion)
 }
Notice that I didn’t add an attribute named “atm.name” or “backendsystem.name”
to the pcommon.Resource representing the Atm and BackendSystem entity
names, that’s because most (not to say all) distributed tracing backend systems
that are compatible with the OTel trace specification, interpret the
pcommon.Resource described in a trace as a Service, therefore they expect
the pcommon.Resource to carry a required attribute named service.name as
prescribed by the resource semantic convention.
We will also use non-required attribute named service.version to represent the
version information for both Atm and BackendSystem entities.
Here is what the tailtracer/model.go file looks like after adding the code for
properly assign the “service.” group attributes:
model.go
package tailtracer

import (
	"math/rand"
	"time"
	"go.opentelemetry.io/collector/pdata/pcommon"
	"go.opentelemetry.io/collector/pdata/ptrace"
	conventions "go.opentelemetry.io/collector/model/semconv/v1.9.0"
)

type Atm struct{
    ID           int64
	Version      string
	Name         string
	StateID      string
	SerialNumber string
	ISPNetwork   string
}

type BackendSystem struct{
	Version       string
	ProcessName   string
	OSType        string
    OSVersion     string
	CloudProvider string
	CloudRegion   string
	Endpoint      string
}

func generateAtm() Atm{
	i := getRandomNumber(1, 2)
    var newAtm Atm

	switch i {
		case 1:
			newAtm = Atm{
				ID: 111,
				Name: "ATM-111-IL",
				SerialNumber: "atmxph-2022-111",
				Version: "v1.0",
				ISPNetwork: "comcast-chicago",
				StateID: "IL",

			}

		case 2:
			newAtm = Atm{
				ID: 222,
				Name: "ATM-222-CA",
				SerialNumber: "atmxph-2022-222",
				Version: "v1.0",
				ISPNetwork: "comcast-sanfrancisco",
				StateID: "CA",
			}
	}

	return newAtm
}

func generateBackendSystem() BackendSystem{
    i := getRandomNumber(1, 3)

	newBackend := BackendSystem{
    	ProcessName: "accounts",
		Version: "v2.5",
		OSType: "lnx",
		OSVersion: "4.16.10-300.fc28.x86_64",
		CloudProvider: "amzn",
		CloudRegion: "us-east-2",
	}

	switch i {
		case 1:
		 	newBackend.Endpoint = "api/v2.5/balance"
		case 2:
		  	newBackend.Endpoint = "api/v2.5/deposit"
		case 3:
			newBackend.Endpoint = "api/v2.5/withdrawn"

	}

	return newBackend
}

func getRandomNumber(min int, max int) int {
	rand.Seed(time.Now().UnixNano())
	i := (rand.Intn(max - min + 1) + min)
    return i
}

func generateTraces() ptrace.Traces{
	traces := ptraces.NewTraces()

	for i := 0; i <= numberOfTraces; i++{
		newAtm := generateAtm()
		newBackendSystem := generateBackendSystem()

		resourceSpan := traces.ResourceSpans().AppendEmpty()
		atmResource := resourceSpan.Resource()
		fillResourceWithAtm(&atmResource, newAtm)

		resourceSpan = traces.ResourceSpans().AppendEmpty()
		backendResource := resourceSpan.Resource()
		fillResourceWithBackendSystem(&backendResource, newBackendSystem)
	}

	return traces
}

func fillResourceWithAtm(resource *pdata.Resource, atm Atm){
   atmAttrs := resource.Attributes()
   atmAttrs.InsertInt("atm.id", atm.ID)
   atmAttrs.InsertString("atm.stateid", atm.StateID)
   atmAttrs.InsertString("atm.ispnetwork", atm.ISPNetwork)
   atmAttrs.InsertString("atm.serialnumber", atm.SerialNumber)
   atmAttrs.InsertString(conventions.AttributeServiceName, atm.Name)
   atmAttrs.InsertString(conventions.AttributeServiceVersion, atm.Version)

}


func fillResourceWithBackendSystem(resource *pdata.Resource, backend BackendSystem){
	backendAttrs := resource.Attributes()
	var osType, cloudProvider string

	switch {
		case backend.CloudProvider == "amzn":
			cloudProvider = conventions.AttributeCloudProviderAWS
		case backend.OSType == "mcrsft":
			cloudProvider = conventions.AttributeCloudProviderAzure
		case backend.OSType == "gogl":
			cloudProvider = conventions.AttributeCloudProviderGCP
	}

	backendAttrs.InsertString(conventions.AttributeCloudProvider, cloudProvider)
	backendAttrs.InsertString(conventions.AttributeCloudRegion, backend.CloudRegion)

	switch {
		case backend.OSType == "lnx":
			osType = conventions.AttributeOSTypeLinux
		case backend.OSType == "wndws":
			osType = conventions.AttributeOSTypeWindows
		case backend.OSType == "slrs":
			osType = conventions.AttributeOSTypeSolaris
	}

	backendAttrs.InsertString(conventions.AttributeOSType, osType)
	backendAttrs.InsertString(conventions.AttributeOSVersion, backend.OSVersion)

	backendAttrs.InsertString(conventions.AttributeServiceName, backend.ProcessName)
	backendAttrs.InsertString(conventions.AttributeServiceVersion, backend.Version)

 }
Check your work
- Imported the
go.opentelemetry.io/collector/model/semconv/v1.9.0package asconventions, in order to have access to all resource semantic conventions attribute names and values.- Updated the
fillResourceWithAtm()function by adding lines to properly assign the “service.name” and “service.version” attributes to thepcommon.Resourcerepresenting theAtmentity- Updated the
fillResourceWithBackendSystem()function by adding lines to properly assign the “service.name” and “service.version” attributes to thepcommon.Resourcerepresenting theBackendSystementity- Updated the
generateTraces()function by adding lines to properly instantiate apcommon.Resourceand fill in the attribute information for bothAtmandBackendSystementities using thefillResourceWithAtm()andfillResourceWithBackendSystem()functions
Representing operations with spans
You now have a ResourceSpan instance with their respective Resource properly
filled with attributes to represent the Atm and BackendSystem entities, you
are ready to represent the operations that each Resource execute as part of a
trace within the ResourceSpan.
In the OTel world, in order for a system to generate telemetry, it needs to be instrumented either manually or automatically through an instrumentation library.
The instrumentation libraries are responsible to set the scope (also known as the instrumentation scope) in which the operations participating on a trace happened and then describe those operations as spans within the context of the trace.
pdata.ResourceSpans has a method named ScopeSpans() which returns an
instance of a helper type called ptrace.ScopeSpansSlice. The
ptrace.ScopeSpansSlice type has methods to help you handle the array of
ptrace.ScopeSpans that will contain as many items as the number of
ptrace.ScopeSpan representing the different instrumentation scopes and the
spans it generated within the context of a trace.
ptrace.ScopeSpansSlice has a method named AppendEmpty() that adds a new
ptrace.ScopeSpans to the array and return it’s reference.
Let’s create a function to instantiate a ptrace.ScopeSpans representing for
the ATM system’s instrumentation scope and it’s spans. Open the
tailtracer/model.go file and add the following function:
 func appendAtmSystemInstrScopeSpans(resourceSpans *ptrace.ResourceSpans) (ptrace.ScopeSpans){
	scopeSpans := resourceSpans.ScopeSpans().AppendEmpty()

    return scopeSpans
}
The ptrace.ScopeSpans has a method named Scope() that returns a reference
for the pcommon.InstrumentationScope instance representing the instrumentation
scope that generated the spans.
pcommon.InstrumentationScope has the following methods to describe an
instrumentation scope:
SetName(v string)sets the name for the instrumentation librarySetVersion(v string)sets the version for the instrumentation libraryName() stringreturns the name associated with the instrumentation libraryVersion() stringreturns the version associated with the instrumentation library
Let’s update the appendAtmSystemInstrScopeSpans function so we can set the
name and version of the instrumentation scope for the new ptrace.ScopeSpans.
Here is what appendAtmSystemInstrScopeSpans looks like after the update:
 func appendAtmSystemInstrScopeSpans(resourceSpans *ptrace.ResourceSpans) (ptrace.ScopeSpans){
	scopeSpans := resourceSpans.ScopeSpans().AppendEmpty()
	scopeSpans.Scope().SetName("atm-system")
	scopeSpans.Scope().SetVersion("v1.0")
	return scopeSpans
}
You can now update the generateTraces() function and add variables to
represent the instrumentation scope used by both Atm and BackendSystem
entities by initializing them with the appendAtmSystemInstrScopeSpans(). Here
is what generateTraces() looks like after the update:
func generateTraces() ptrace.Traces{
	traces := ptraces.NewTraces()

	for i := 0; i <= numberOfTraces; i++{
		newAtm := generateAtm()
		newBackendSystem := generateBackendSystem()

		resourceSpan := traces.ResourceSpans().AppendEmpty()
		atmResource := resourceSpan.Resource()
		fillResourceWithAtm(&atmResource, newAtm)

		atmInstScope := appendAtmSystemInstrScopeSpans(&resourceSpan)

		resourceSpan = traces.ResourceSpans().AppendEmpty()
		backendResource := resourceSpan.Resource()
		fillResourceWithBackendSystem(&backendResource, newBackendSystem)

		backendInstScope := appendAtmSystemInstrScopeSpans(&resourceSpan)
	}

	return traces
}
At this point, you have everything needed to represent the telemetry generation entities in your system and the instrumentation scope that is responsible to identify operations and generate the traces for the system. The next step is to finally create the spans representing the operations that the given instrumentation scope generated as part of a trace.
ptrace.ScopeSpans has a method named Spans() which returns an instance of a
helper type called ptrace.SpanSlice. The ptrace.SpanSlice type has methods
to help you handle the array of ptrace.Span that will contain as many items as
the number of operations the instrumentation scope was able to identify and
describe as part of the trace.
ptrace.SpanSlice has a method named AppendEmpty() that adds a new
ptrace.Span to the array and return it’s reference.
ptrace.Span has the following methods to describe an operation:
SetTraceID(v pcommon.TraceID)sets thepcommon.TraceIDuniquely identifying the trace which this span is associated withSetSpanID(v pcommon.SpanID)sets thepcommon.SpanIDuniquely identifying this span within the context of the trace it is associated withSetParentSpanID(v pcommon.SpanID)setspcommon.SpanIDfor the parent span/operation in case the operation represented by this span is executed as part of the parent (nested)SetName(v string)sets the name of the operation for the spanSetKind(v ptrace.SpanKind)setsptrace.SpanKinddefining what kind of operation the span represents.SetStartTimestamp(v pcommon.Timestamp)sets thepcommon.Timestamprepresenting the date and time when the operation represented by the span has startedSetEndTimestamp(v pcommon.Timestamp)sets thepcommon.Timestamprepresenting the date and time when the operation represented by the span has ended
As you can see per the methods above, a ptrace.Span is uniquely identified by
2 required IDs; their own unique ID represented by the pcommon.SpanID type and
the ID of the trace they are associated with represented by a pcommon.TraceID
type.
The pcommon.TraceID has to carry a globally unique ID represented through a 16
byte array and should follow the
W3C Trace Context specification
while the pcommon.SpanID is a unique ID within the context of the trace they
are associated with and it’s represented through a 8 byte array.
The pcommon package provides the following helper functions to generate the
span’s IDs:
NewTraceID(bytes [16]byte) pcommon.TraceIDreturns thepcommon.TraceIDfor the given byte arrayNewSpanID(bytes [8]byte) pcommon.SpanIDreturns thepcommon.SpanIDfor the given byte array
For this tutorial, you will be creating the IDs using functions from
github.com/google/uuid package for the pcommon.TraceID and functions from
the crypto/rand package to randomly generate the pcommon.SpanID. Open the
tailtracer/model.go file and add both packages to the import statement;
after that, add the following functions to help generate both IDs:
func NewTraceID() pdata.TraceID{
	return pdata.NewTraceID(uuid.New())
}

func NewSpanID() pdata.SpanID {
	var rngSeed int64
	_ = binary.Read(crand.Reader, binary.LittleEndian, &rngSeed)
	randSource := rand.New(rand.NewSource(rngSeed))

	var sid [8]byte
	randSource.Read(sid[:])
    spanID := pdata.NewSpanID(sid)

	return spanID
}
Now that you have a way to properly identify the spans, you can start creating them to represent the operations within and across the entities in your system.
As part of the generateBackendSystem() function, we have randomly assigned the
operations that the BackEndSystem entity can provide as services to the
system. We will now open the tailtracer/model.go file and a function called
appendTraceSpans() that will be responsible to create a trace and append spans
representing the BackendSystem operations. Here is what the initial
implementation for the appendTraceSpans() function looks like:
func appendTraceSpans(backend *BackendSystem, backendScopeSpans *ptrace.ScopeSpans, atmScopeSpans *ptrace.ScopeSpans){
	traceId := NewTraceID()
	backendSpanId := NewSpanID()

	backendDuration, _ := time.ParseDuration("1s")
    backendSpanStartTime := time.Now()
    backendSpanFinishTime := backendSpanStartTime.Add(backendDuration)


	backendSpan := backendScopeSpans.Spans().AppendEmpty()
	backendSpan.SetTraceID(traceId)
	backendSpan.SetSpanID(backendSpanId)
	backendSpan.SetName(backend.Endpoint)
	backendSpan.SetKind(pdata.SpanKindServer)
	backendSpan.SetStartTimestamp(pdata.NewTimestampFromTime(backendSpanStartTime))
	backendSpan.SetEndTimestamp(pdata.NewTimestampFromTime(backendSpanFinishTime))

}
Check your work
- Added
traceIdandbackendSpanIdvariables to respectively represent the trace and the span id and initialized them with the helper functions created previously- Added
backendSpanStartTimeandbackendSpanFinishTimeto represent the start and the end time of the operation. For the tutorial, anyBackendSystemoperation will take 1 second.- Added a variable called
backendSpanwhich will hold the instance of theptrace.Spanrepresenting this operation.- Setting the
Nameof the span with theEndpointfield value from theBackendSysteminstance- Setting the
Kindof the span asptrace.SpanKindServer. Take a look at SpanKind section within the trace specification to understand how to properly define SpanKind.- Used all the methods mentioned before to fill the
ptrace.Spanwith the proper values to represent theBackendSystemoperation
You probably noticed that there are 2 references to ptrace.ScopeSpans as
parameters in the appendTraceSpans() function, but we only used one of them.
Don’t worry about it for now, we will get back to it later.
You will now update the generateTraces() function so it can actually generate
the trace by calling the appendTraceSpans() function. Here is what the updated
generateTraces() function looks like:
func generateTraces() ptrace.Traces{
	traces := ptraces.NewTraces()

	for i := 0; i <= numberOfTraces; i++{
		newAtm := generateAtm()
		newBackendSystem := generateBackendSystem()

		resourceSpan := traces.ResourceSpans().AppendEmpty()
		atmResource := resourceSpan.Resource()
		fillResourceWithAtm(&atmResource, newAtm)

		atmInstScope := appendAtmSystemInstrScopeSpans(&resourceSpan)

		resourceSpan = traces.ResourceSpans().AppendEmpty()
		backendResource := resourceSpan.Resource()
		fillResourceWithBackendSystem(&backendResource, newBackendSystem)

		backendInstScope := appendAtmSystemInstrScopeSpans(&resourceSpan)


		appendTraceSpans(&newBackendSystem, &backendInstScope, &atmInstScope)
	}

	return traces
}
You now have the BackendSystem entity and it’s operations represented in spans
within a proper trace context! All you need to do is to push the generated trace
through the pipeline so the next consumer (either a processor or an exporter)
can receive and process it.
consumer.Traces has a method called ConsumeTraces() which is responsible to
push the generated traces to the next consumer in the pipeline. All you need to
do now is to update the Start() method within the tailtracerReceiver type
and add the code to use it.
Open the tailtracer/trace-receiver.go file and update the Start() method as
follow:
func (tailtracerRcvr *tailtracerReceiver) Start(ctx context.Context, host component.Host) error {
    tailtracerRcvr.host = host
    ctx = context.Background()
	ctx, tailtracerRcvr.cancel = context.WithCancel(ctx)

	interval, _ := time.ParseDuration(tailtracerRcvr.config.Interval)
	go func() {
		ticker := time.NewTicker(interval)
		defer ticker.Stop()
		for {
			select {
			case <-ticker.C:
				tailtracerRcvr.logger.Info("I should start processing traces now!")
				tailtracerRcvr.nextConsumer.ConsumeTraces(ctx, generateTraces())
			case <-ctx.Done():
				return
			}
		}
	}()

	return nil
}
Check your work
- Added a line under the
case <=ticker.Ccondition calling thetailtracerRcvr.nextConsumer.ConsumeTraces()method passing the new context created within theStart()method (ctx) and a call to thegenerateTraces()function so the generated traces can be pushed to the next consumer in the pipeline
If you run your dev-otelcol here is what the output should look like after 2
minutes running:
Starting: /Users/rquedas/go/bin/dlv dap --check-go-version=false --listen=127.0.0.1:54625 --log-dest=3 from /Users/rquedas/Documents/vscode-workspace/otel4devs/collector/receiver/trace-receiver/dev-otelcol
DAP server listening at: 127.0.0.1:54625
2022-03-21T15:44:22.737-0500	info	builder/exporters_builder.go:255	Exporter was built.	{"kind": "exporter", "name": "logging"}
2022-03-21T15:44:22.737-0500	info	builder/exporters_builder.go:255	Exporter was built.	{"kind": "exporter", "name": "jaeger"}
2022-03-21T15:44:22.737-0500	info	builder/pipelines_builder.go:223	Pipeline was built.	{"name": "pipeline", "name": "traces"}
2022-03-21T15:44:22.738-0500	info	builder/receivers_builder.go:226	Receiver was built.	{"kind": "receiver", "name": "otlp", "datatype": "traces"}
2022-03-21T15:44:22.738-0500	info	builder/receivers_builder.go:226	Receiver was built.	{"kind": "receiver", "name": "tailtracer", "datatype": "traces"}
2022-03-21T15:44:22.738-0500	info	service/service.go:82	Starting extensions...
2022-03-21T15:44:22.738-0500	info	service/service.go:87	Starting exporters...
2022-03-21T15:44:22.738-0500	info	builder/exporters_builder.go:40	Exporter is starting...	{"kind": "exporter", "name": "logging"}
2022-03-21T15:44:22.738-0500	info	builder/exporters_builder.go:48	Exporter started.	{"kind": "exporter", "name": "logging"}
2022-03-21T15:44:22.738-0500	info	builder/exporters_builder.go:40	Exporter is starting...	{"kind": "exporter", "name": "jaeger"}
2022-03-21T15:44:22.738-0500	info	builder/exporters_builder.go:48	Exporter started.	{"kind": "exporter", "name": "jaeger"}
2022-03-21T15:44:22.738-0500	info	service/service.go:92	Starting processors...
2022-03-21T15:44:22.738-0500	info	jaegerexporter@v0.46.0/exporter.go:186	State of the connection with the Jaeger Collector backend	{"kind": "exporter", "name": "jaeger", "state": "IDLE"}
2022-03-21T15:44:22.738-0500	info	builder/pipelines_builder.go:54	Pipeline is starting...	{"name": "pipeline", "name": "traces"}
2022-03-21T15:44:22.738-0500	info	builder/pipelines_builder.go:65	Pipeline is started.	{"name": "pipeline", "name": "traces"}
2022-03-21T15:44:22.738-0500	info	service/service.go:97	Starting receivers...
2022-03-21T15:44:22.738-0500	info	builder/receivers_builder.go:68	Receiver is starting...	{"kind": "receiver", "name": "otlp"}
2022-03-21T15:44:22.738-0500	info	otlpreceiver/otlp.go:69	Starting GRPC server on endpoint localhost:55680	{"kind": "receiver", "name": "otlp"}
2022-03-21T15:44:22.741-0500	info	builder/receivers_builder.go:73	Receiver started.	{"kind": "receiver", "name": "otlp"}
2022-03-21T15:44:22.741-0500	info	builder/receivers_builder.go:68	Receiver is starting...	{"kind": "receiver", "name": "tailtracer"}
2022-03-21T15:44:22.741-0500	info	builder/receivers_builder.go:73	Receiver started.	{"kind": "receiver", "name": "tailtracer"}
2022-03-21T15:44:22.741-0500	info	service/telemetry.go:109	Setting up own telemetry...
2022-03-21T15:44:22.741-0500	info	service/telemetry.go:129	Serving Prometheus metrics	{"address": ":8888", "level": "basic", "service.instance.id": "4b134d3e-2822-4360-b2c6-7030bea0beec", "service.version": "latest"}
2022-03-21T15:44:22.742-0500	info	service/collector.go:248	Starting dev-otelcol...	{"Version": "1.0.0", "NumCPU": 12}
2022-03-21T15:44:22.742-0500	info	service/collector.go:144	Everything is ready. Begin running and processing data.
2022-03-21T15:44:23.739-0500	info	jaegerexporter@v0.46.0/exporter.go:186	State of the connection with the Jaeger Collector backend	{"kind": "exporter", "name": "jaeger", "state": "READY"}
2022-03-21T15:45:22.743-0500	info	tailtracer/trace-receiver.go:33	I should start processing traces now!	{"kind": "receiver", "name": "tailtracer"}
2022-03-21T15:45:22.743-0500	INFO	loggingexporter/logging_exporter.go:40	TracesExporter	{"#spans": 1}
2022-03-21T15:45:22.743-0500	DEBUG	loggingexporter/logging_exporter.go:49	ResourceSpans #0
Resource SchemaURL:
Resource labels:
     -> atm.id: INT(222)
     -> atm.stateid: STRING(CA)
     -> atm.ispnetwork: STRING(comcast-sanfrancisco)
     -> atm.serialnumber: STRING(atmxph-2022-222)
     -> service.name: STRING(ATM-222-CA)
     -> service.version: STRING(v1.0)
ScopeSpans #0
ScopeSpans SchemaURL:
InstrumentationScope atm-system v1.0
ResourceSpans #1
Resource SchemaURL:
Resource labels:
     -> cloud.provider: STRING(aws)
     -> cloud.region: STRING(us-east-2)
     -> os.type: STRING(linux)
     -> os.version: STRING(4.16.10-300.fc28.x86_64)
     -> service.name: STRING(accounts)
     -> service.version: STRING(v2.5)
ScopeSpans #0
ScopeSpans SchemaURL:
InstrumentationScope atm-system v1.0
Span #0
    Trace ID       : 5cce8a774d4546c2a5cbdeb607ec74c9
    Parent ID      :
    ID             : bb25c05c7fb13084
    Name           : api/v2.5/balance
    Kind           : SPAN_KIND_SERVER
    Start time     : 2022-03-21 20:45:22.743385 +0000 UTC
    End time       : 2022-03-21 20:45:23.743385 +0000 UTC
    Status code    : STATUS_CODE_OK
    Status message :
2022-03-21T15:46:22.743-0500	info	tailtracer/trace-receiver.go:33	I should start processing traces now!	{"kind": "receiver", "name": "tailtracer"}
2022-03-21T15:46:22.744-0500	INFO	loggingexporter/logging_exporter.go:40	TracesExporter	{"#spans": 1}
2022-03-21T15:46:22.744-0500	DEBUG	loggingexporter/logging_exporter.go:49	ResourceSpans #0
Resource SchemaURL:
Resource labels:
     -> atm.id: INT(111)
     -> atm.stateid: STRING(IL)
     -> atm.ispnetwork: STRING(comcast-chicago)
     -> atm.serialnumber: STRING(atmxph-2022-111)
     -> service.name: STRING(ATM-111-IL)
     -> service.version: STRING(v1.0)
ScopeSpans #0
ScopeSpans SchemaURL:
InstrumentationScope atm-system v1.0
ResourceSpans #1
Resource SchemaURL:
Resource labels:
     -> cloud.provider: STRING(aws)
     -> cloud.region: STRING(us-east-2)
     -> os.type: STRING(linux)
     -> os.version: STRING(4.16.10-300.fc28.x86_64)
     -> service.name: STRING(accounts)
     -> service.version: STRING(v2.5)
ScopeSpans #0
ScopeSpans SchemaURL:
InstrumentationScope atm-system v1.0
Span #0
    Trace ID       : 8a6ca822db0847f48facfebbb08bbb9e
    Parent ID      :
    ID             : 7cf668c1273ecee5
    Name           : api/v2.5/withdrawn
    Kind           : SPAN_KIND_SERVER
    Start time     : 2022-03-21 20:46:22.74404 +0000 UTC
    End time       : 2022-03-21 20:46:23.74404 +0000 UTC
    Status code    : STATUS_CODE_OK
    Status message :
Here is what the generated trace looks like in Jaeger:
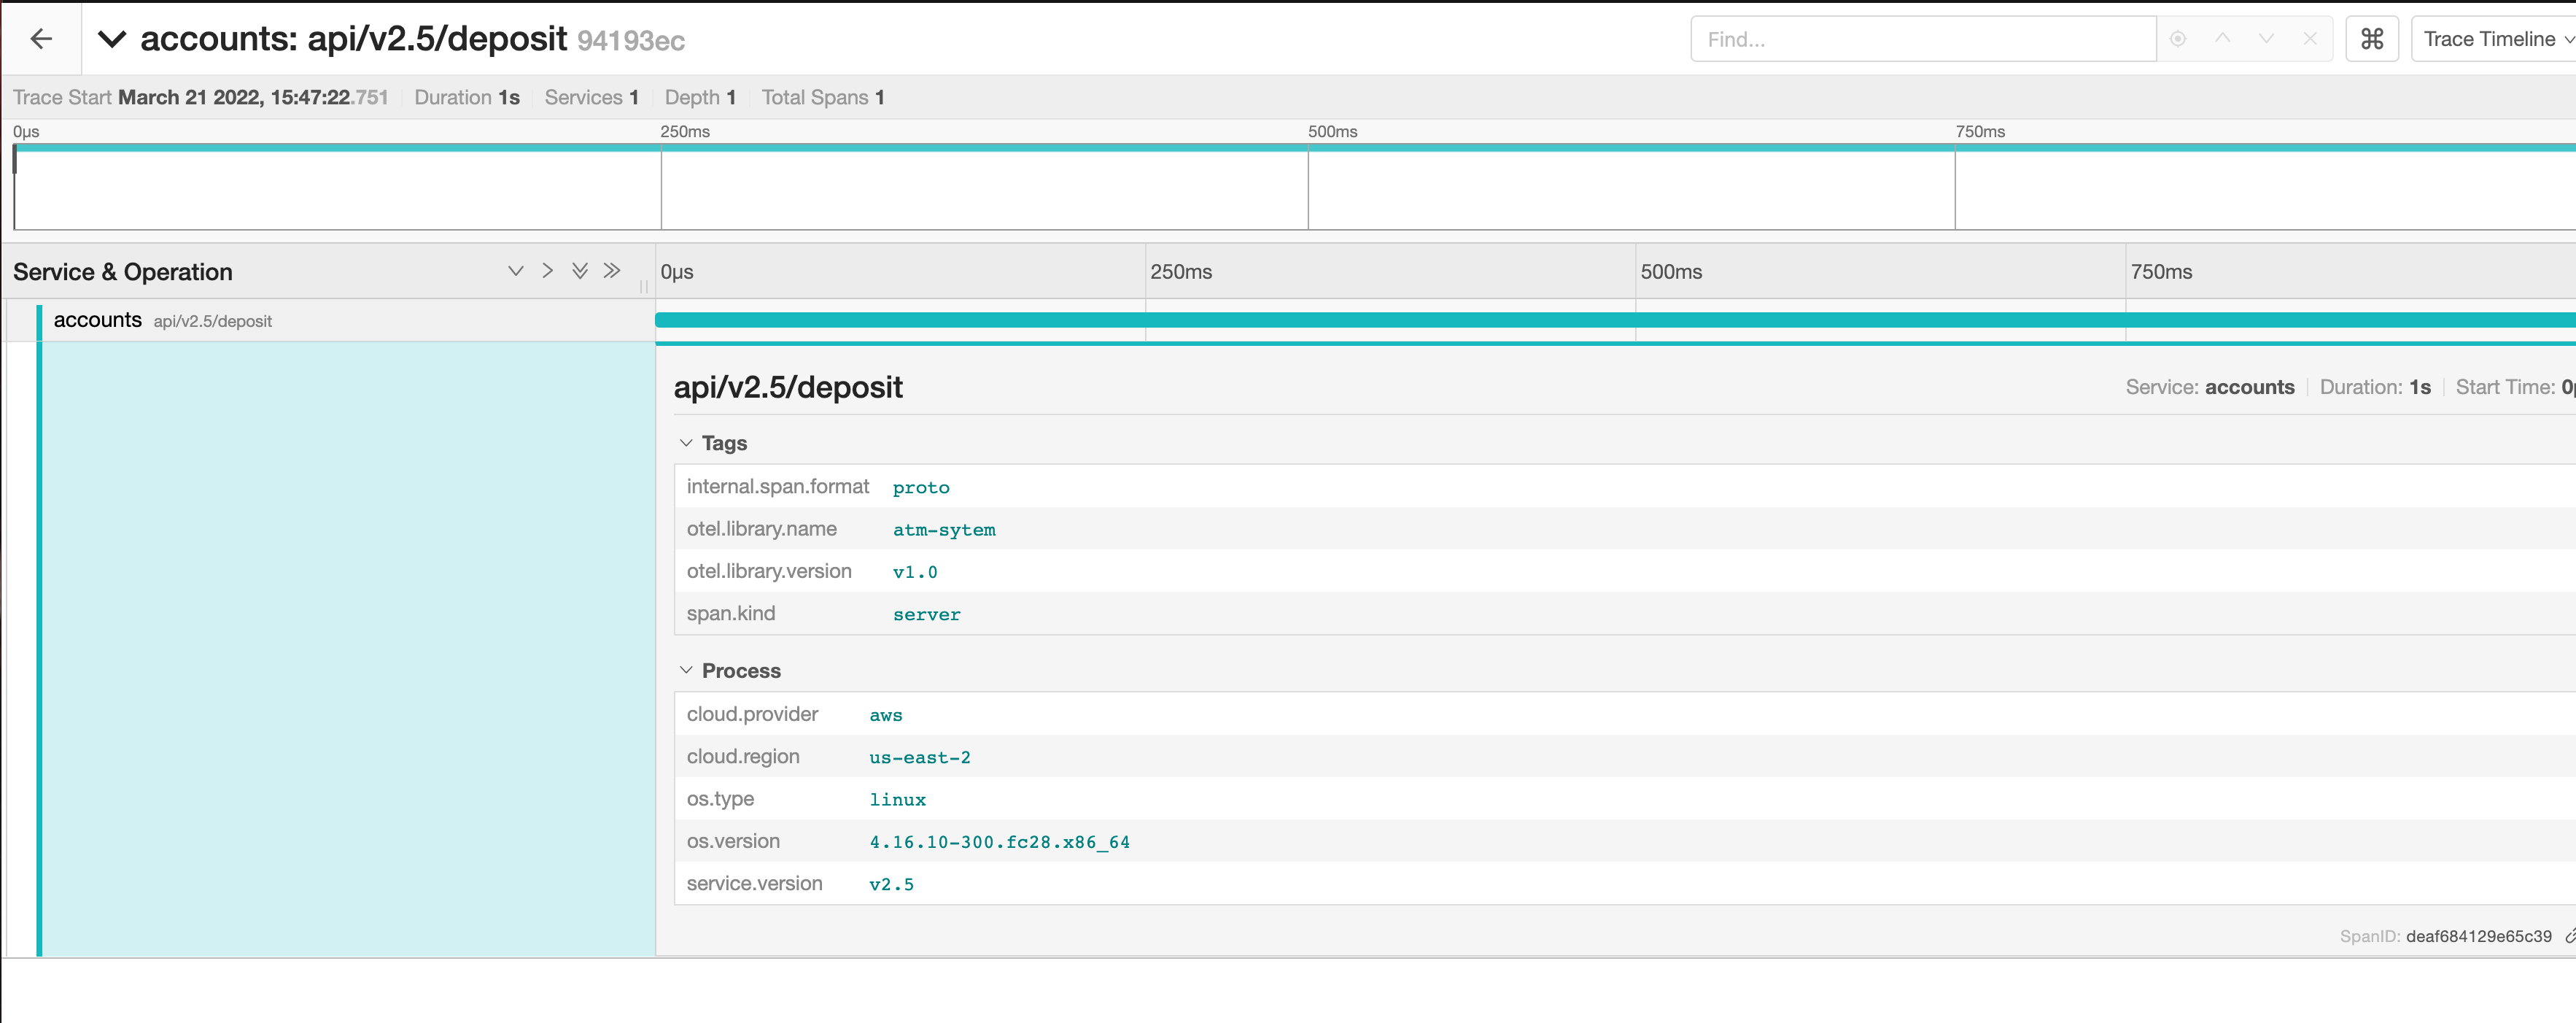
What you currently see in Jaeger is the representation of a service that is
receiving a request from an external entity that isn’t instrumented by an OTel
SDK, therefore it can’t be identified as the origin/start of the trace. In order
for a ptrace.Span to understand it is representing an operation that was
execute as a result of another operation originated either within or outside
(nested/child) of the Resource within the same trace context you will need to:
- Set the same trace context as the caller operation by calling the
SetTraceID()method and passing thepcommon.TraceIDof the parent/callerptrace.Spanas a parameter. - Define who is the caller operation within the context of the trace by calling
SetParentId()method and passing thepcommon.SpanIDof the parent/callerptrace.Spanas a parameter.
You will now create a ptrace.Span representing the Atm entity operations and
set it as the parent for BackendSystem span. Open the tailtracer/model.go
file and update the appendTraceSpans() function as follow:
func appendTraceSpans(backend *BackendSystem, backendScopeSpans *ptrace.ScopeSpans, atmScopeSpans *ptrace.ScopeSpans){
	traceId := NewTraceID()

	var atmOperationName string

	switch {
	case strings.Contains(backend.Endpoint, "balance"):
        atmOperationName = "Check Balance"
	case strings.Contains(backend.Endpoint, "deposit"):
		atmOperationName = "Make Deposit"
	case strings.Contains(backend.Endpoint, "withdraw"):
		atmOperationName = "Fast Cash"
	}

	atmSpanId := NewSpanID()
    atmSpanStartTime := time.Now()
    atmDuration, _ := time.ParseDuration("4s")
    atmSpanFinishTime := atmSpanStartTime.Add(atmDuration)


	atmSpan := atmScopeSpans.Spans().AppendEmpty()
	atmSpan.SetTraceID(traceId)
	atmSpan.SetSpanID(atmSpanId)
	atmSpan.SetName(atmOperationName)
	atmSpan.SetKind(ptrace.SpanKindClient)
	atmSpan.Status().SetCode(ptrace.StatusCodeOk)
	atmSpan.SetStartTimestamp(pcommon.NewTimestampFromTime(atmSpanStartTime))
	atmSpan.SetEndTimestamp(pcommon.NewTimestampFromTime(atmSpanFinishTime))


	backendSpanId := NewSpanID()

	backendDuration, _ := time.ParseDuration("2s")
    backendSpanStartTime := atmSpanStartTime.Add(backendDuration)


	backendSpan := backendScopeSpans.Spans().AppendEmpty()
	backendSpan.SetTraceID(atmSpan.TraceID())
	backendSpan.SetSpanID(backendSpanId)
	backendSpan.SetParentSpanID(atmSpan.SpanID())
	backendSpan.SetName(backend.Endpoint)
	backendSpan.SetKind(ptrace.SpanKindServer)
	backendSpan.Status().SetCode(ptrace.StatusCodeOk)
	backendSpan.SetStartTimestamp(pcommon.NewTimestampFromTime(backendSpanStartTime))
	backendSpan.SetEndTimestamp(atmSpan.EndTimestamp())

}
Go ahead and run your dev-otelcol again and after 2 minutes running, you
should start seeing traces in Jaeger like the following:
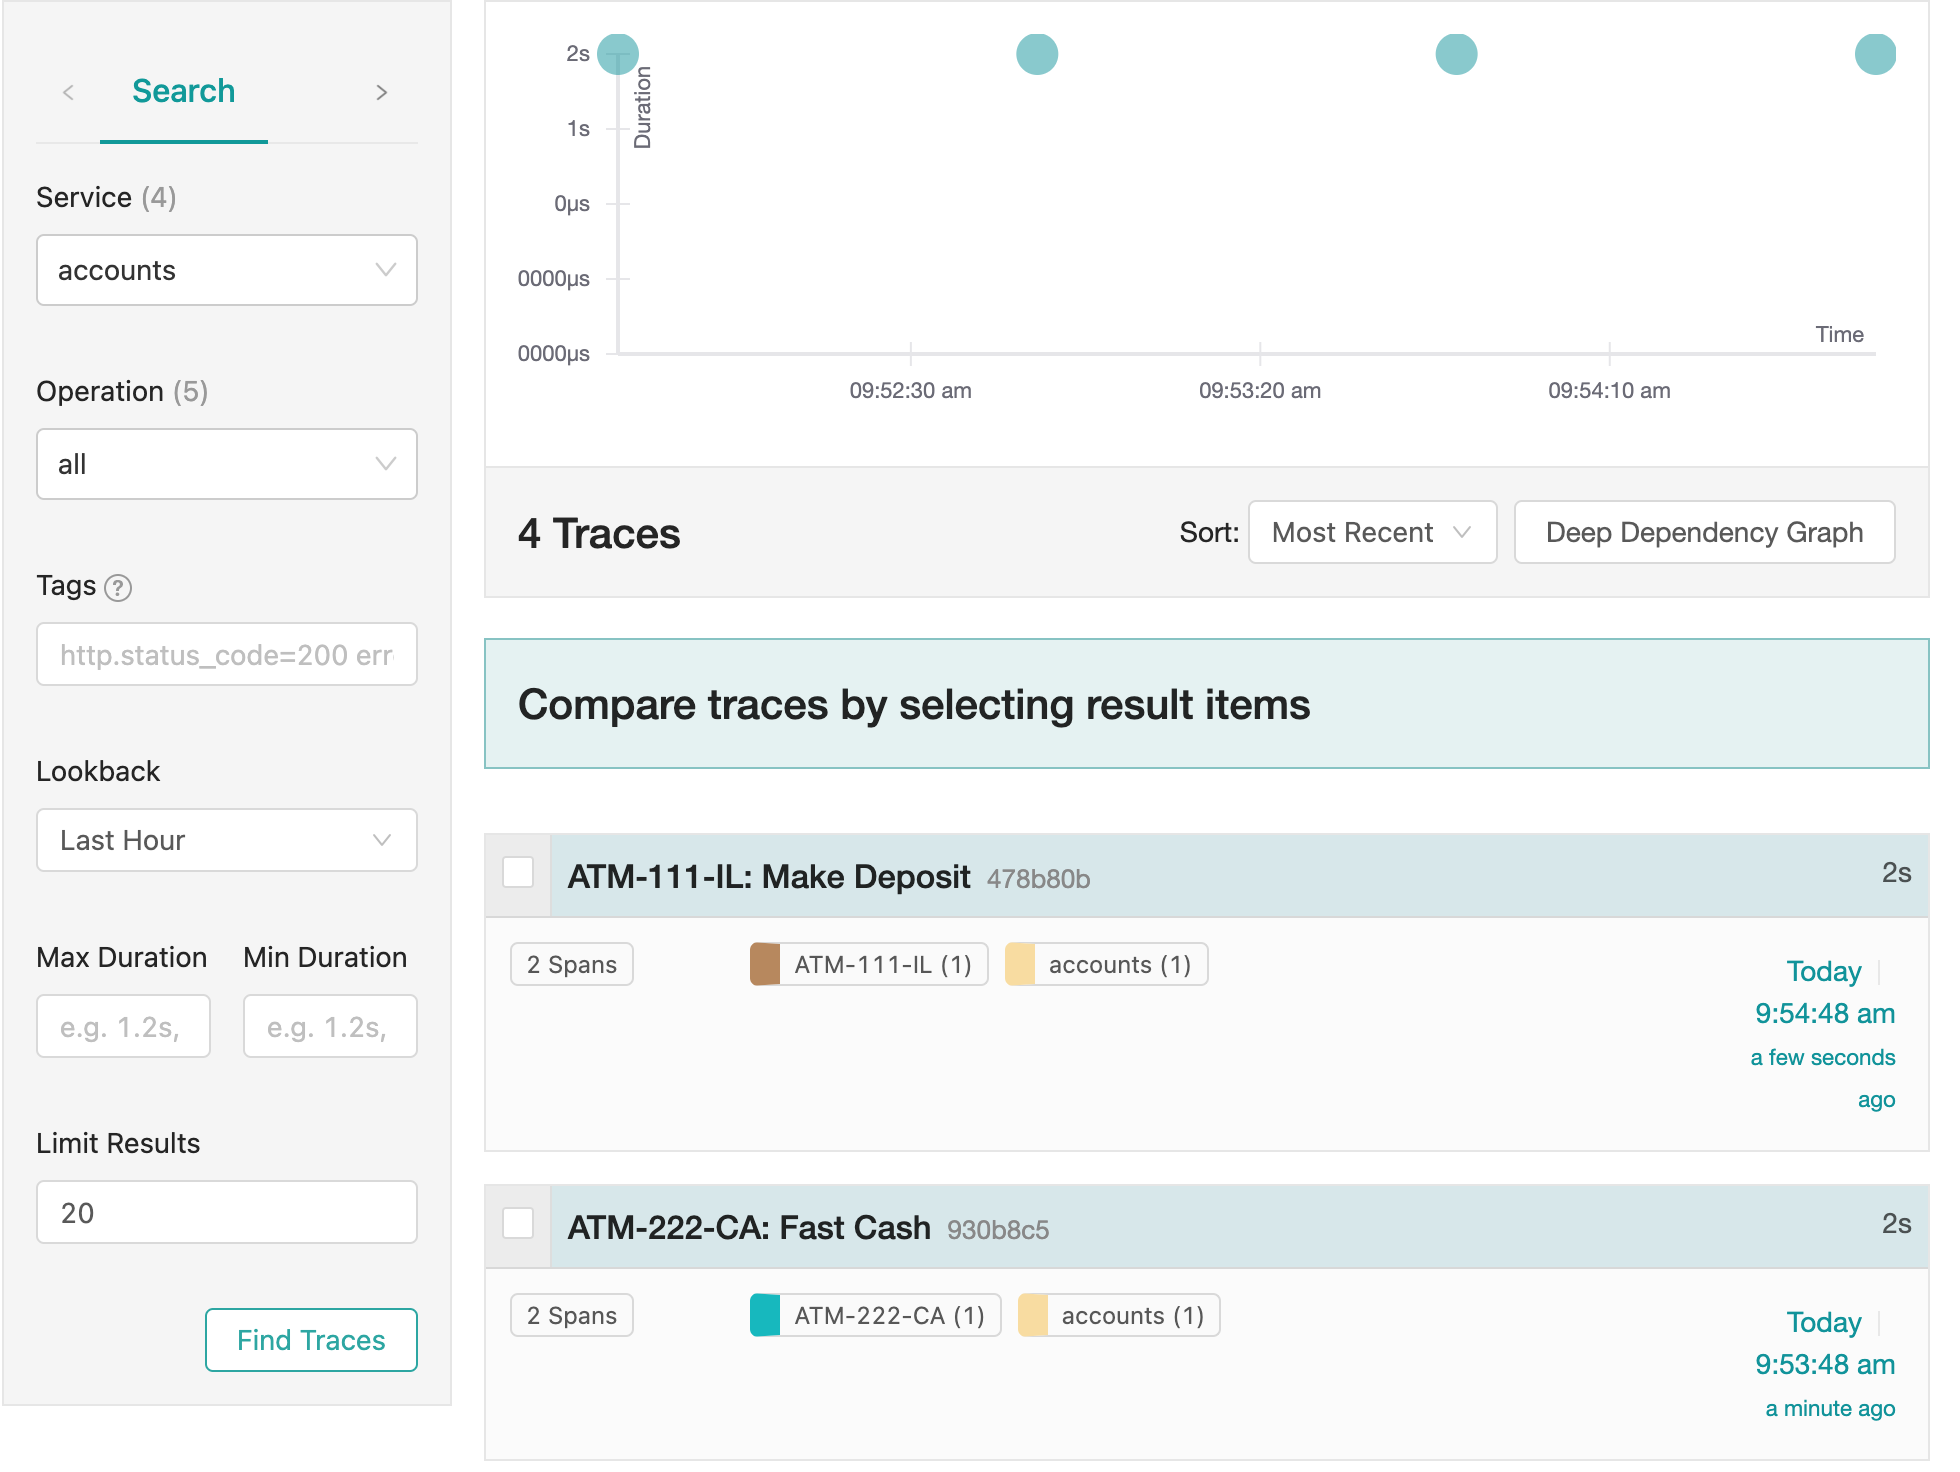
We now have services representing both the Atm and the BackendSystem
telemetry generation entities in our system and can fully understand how both
entities are been used and contributing to the performance of an operation
executed by an user.
Here is the detailed view of one of those traces in Jaeger:
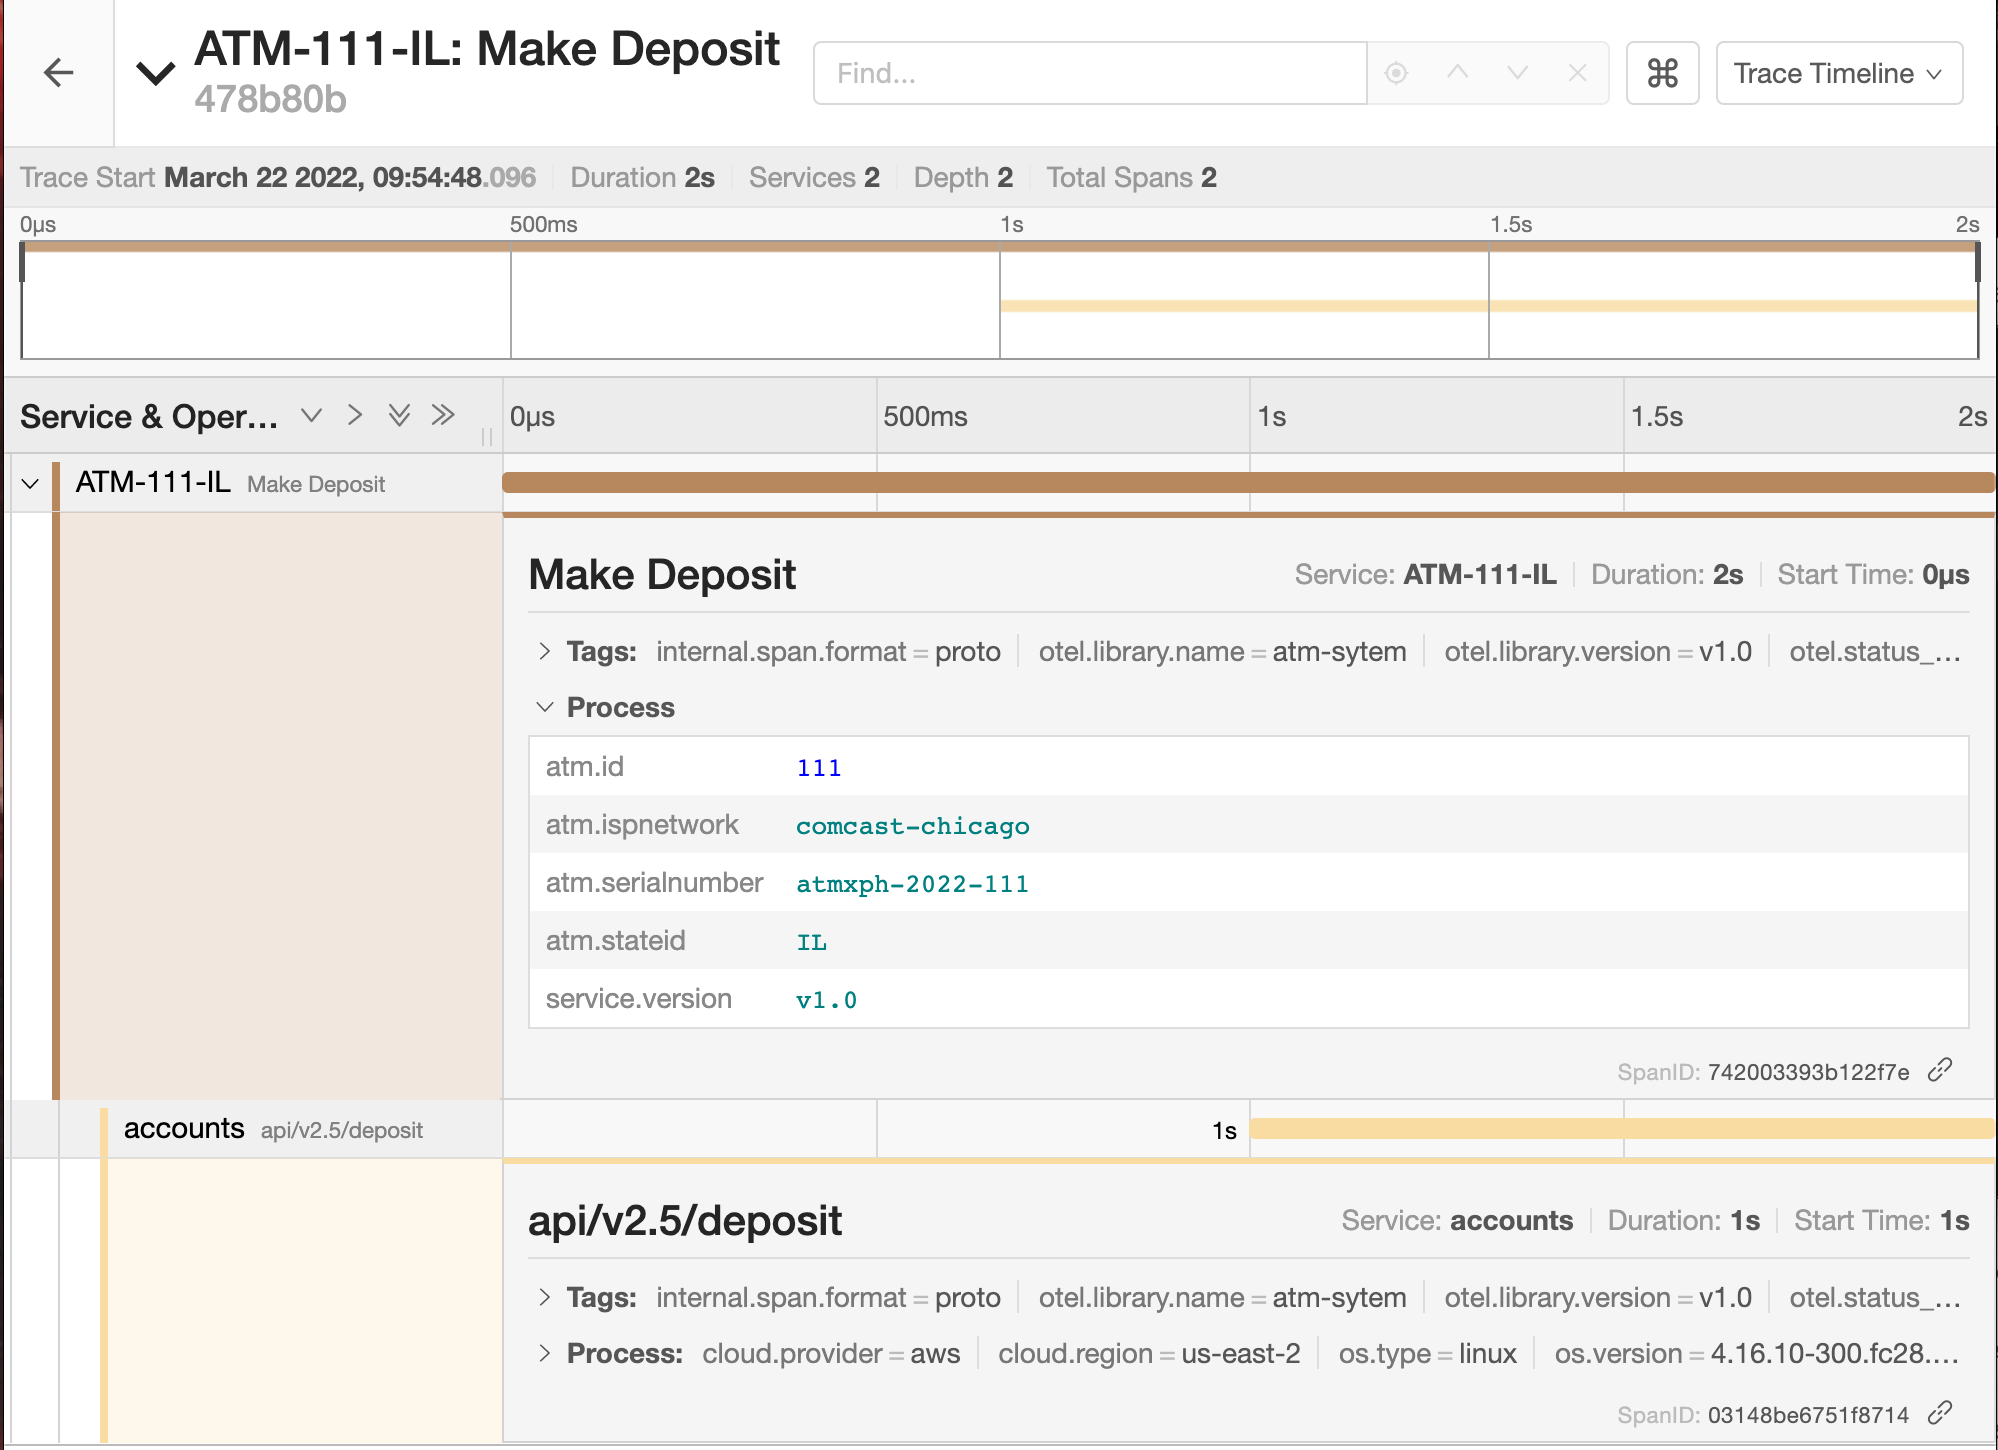
That’s it! You have now reached the end of this tutorial and successfully implemented a trace receiver, congratulations!